Share
Prometheus is a popular open-source monitoring and alerting toolkit managed by the Cloud Native Computing Foundation (CNCF) and used by many customers worldwide. It has been particularly popular with DevOps users as a tool for monitoring Kubernetes on AWS.
Amazon Managed Service for Prometheus (AMP) is a Prometheus-compatible managed service offering that enables customers to monitor containerized applications and infrastructure at scale using AWS cloud. This article will aim to explore this new solution to help readers understand the solution offering and its key features and capabilities in more detail.
- Use the links below to read about:
- What Is Prometheus?
- Prometheus Architecture and Ecosystem
- Amazon Managed Service for Prometheus: Capabilities
- Amazon Prometheus Pricing and Availability
- Conclusion
- FAQs
What Is Prometheus?
Prometheus is a well-known open-source monitoring and alerting solution that integrates with various systems, both natively and through the use of specific plug-ins. It collects and stores metrics data from the systems and applications it monitors in the form of time series data (information with timestamps).
Prometheus Architecture and Ecosystem
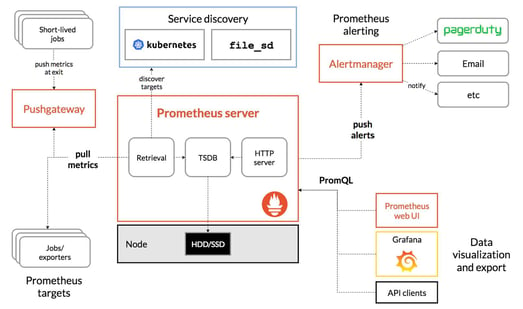 Prometheus architecture and ecosystem components (image credit: Prometheus)
Prometheus is a multi-component solution that consist of components such as:
- Prometheus server: Scrapes and stores time series data from applications such as web applications locally for analysis. Prometheus server scrapes metrics data from various applications and systems (such as request times from a web server, or active connections from a database), either directly or via a push gateway, which are typically HTTP endpoints.
Once this data is collected on the Prometheus server, it is then stored locally as time-serialized data metrics which can then be used for analytical purposes and subsequent alerting via the alert manager.
- Prometheus client libraries: Enables instrumenting application code. When building software, developers can leverage these libraries (which are available in various languages such as Go, Java, Ruby, Python, etc.) to integrate their applications to Prometheus for sending metrics.
- Push gateway: Acts as a gateway for ephemeral and batch jobs (short-lived jobs) to send their metrics during their short-lived operations.
- Exporters: Libraries that help export metrics from third party systems as Prometheus metrics.
- Alert manager: Enables handling alerts via push notifications.
Designed as a reliable, standalone engine that is not dependent on external components (such as remote services), Prometheus can be used for various application troubleshooting and diagnosis purposes when either the main parts of an application or the underlying infrastructure breaks.
Prometheus employs a multi-dimensional data model where data is typically stored as time series data where timestamped values for each metric is stored for analysis. Each time series has a unique “metric name” identifier and an optional key-value pair, which are referred to as labels.
Prometheus also supports a functional query language called PromQL—short for Prometheus Query Language—which is used for real time interrogation of the time series data it holds. The output of these queries can be shown as tabular data, graphs, or be consumed by external systems via the HTTP API on the Prometheus server.
In addition to time series data, Prometheus also allows the storing and handling of temporary derived time series data originating as a result of various PromQL queries using the labels.
The time-serialized data stored on the Prometheus server can also be visualized using popular open-source visualization engines such as Grafana.
Prometheus and Kubernetes
Given its design (focused on reliability over accuracy, ability to capture transient and short lived metrics), it is ideally suited for dynamic systems such as microservices or containerized workloads such as Kubernetes, where its querying capability and multi-dimensional data model become its key strengths. As a result, Prometheus has been widely adopted by the DevOps community as the de-facto monitoring tool of choice for providing monitoring and analytics services for Kubernetes environments in the cloud as well as on premises.
Amazon Managed Service for Prometheus: Capabilities
AWS Managed Service for Prometheus is a Prometheus-compatible monitoring and alerting solution that is available on AWS as an Amazon managed service. AWS Prometheus makes it easier for AWS customers to monitor containerized applications such as those deployed on Kubernetes at scale.
The service is integrated with Amazon Elastic Kubernetes Service (EKS), Amazon Elastic Container Service (ECS), as well as AWS Distro for OpenTelemetry (ADOT).
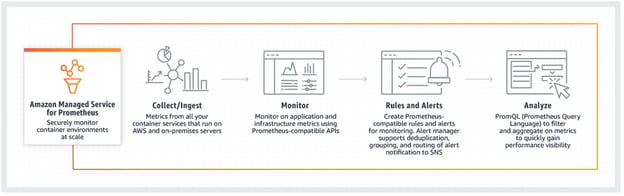 (Image credit AWS)
This new AWS Prometheus service provides an alternative to self-managed Prometheus deployments, where customers are required to deploy Prometheus components manually onto their compute infrastructures, such as EC2-based and managed Kubernetes platforms.
With Amazon Managed Service for Prometheus, AWS customers can readily consume the Prometheus monitoring service which automatically scales as the needs of the monitoring environment grow (such as the growth of your Kubernetes cluster) without the need for the heavy lifting required to manually scale the underlying Prometheus environment. This provides faster time to market and reduced set up costs for the users.
This AWS Prometheus service integrates with other AWS security and compliance tools and solutions too. AWS Prometheus can collect Prometheus metrics from Amazon EC2, Amazon ECS, and Amazon EKS environments easily using AWS Distro for OpenTelemetry (which negates the need to manually instrument customer applications), or even using the native Prometheus collection agents. AWS Prometheus also supports an API capability that enables self-managed Kubernetes clusters on AWS and on-premises to connect to the Amazon Prometheus service to provide further choice and flexibility for the customers.
In addition, this AWS Prometheus service also supports the familiar PromQL to query, filter, aggregate, and alert on all Prometheus-supported metric types. This makes it possible for Prometheus users to continue to leverage AWS Prometheus in the same way as they are used to with the self-managed option. Thanks to the native integration with AWS Identity and Access Management, users can also benefit from AWS native authentication for security and access, with AWS Organizations integration providing federated policy control.
To ensure availability, it is inherently deployed across multiple AWS Availability Zones as well as across multiple AWS regions. Amazon Prometheus also benefits from AWS’s low-latency, high-throughput backbone connectivity, which provides many AWS customers with the highest network performance by default.
With the Amazon Prometheus service, users are provided with the same Grafana integration as the native Prometheus solution for data visualization and analytics. The Grafana Prometheus data source plug-in is easily configurable to query data from the Amazon Prometheus service while AWS customers also have the added choice to leverage the Amazon-managed Grafana offering to make it easier for single-pane-of-glass data visualization across multiple data sources, negating the need to deploy your own Grafana servers.
Amazon Prometheus Pricing and Availability
AWS Prometheus provides a cost-effective Prometheus solution for AWS customers where customers only pay for what they use, without any upfront fees or commitments. Pricing for the service is typically based on metrics ingested, stored, and queried via AWS Prometheus.
Amazon Managed Service for Prometheus is also included within the Amazon Free Tier. Up to 40 million metric samples ingested can be free of charge for Free Tier customers with 10 GB of Metrics stored (as of the writing of this article). This enables AWS customers to get started with Amazon Managed Service for Prometheus without an upfront investment.
Click here for more on Amazon Prometheus pricing (including the link to the calculator).
At the time of writing this article, Amazon Managed Service for Prometheus is only available in a select set of AWS Regions. You can find the full list of AWS Regional services here.
Conclusion
Prometheus is the de-facto application and service monitoring and analytics solutions for containerized workloads such as Kubernetes. AWS Prometheus is a Prometheus-friendly managed service from Amazon, available on the AWS cloud as a highly scalable, highly available Prometheus deployment that can be readily consumed by AWS customers without the need for the underlying infrastructure provisioning and deployment required in a self-managed Prometheus deployment.
However, it is important for customers to note that the AWS Prometheus has availability limitations in some AWS regions as well as some operational differences (such as the lack of direct integration with PagerDuty receiver to route alerts to internal teams).
Customers can get around these by deploying native Prometheus service on Amazon EC2 instances, Amazon EKS, etc. and configuring the Prometheus environment manually for their specific requirements.
Users deploying native Prometheus also have the chance to leverage Cloud Volumes ONTAP, the industry-leading enterprise data management platform from NetApp. Using Cloud Volumes ONTAP, DevOps teams using Prometheus can achieve RPO=0 high availability, potential storage cost savings of up to 70%, and an increase in query speed by up to 66% thanks to the enterprise grade storage efficiency services and the performance improvements.

FAQs
What is AWS Prometheus?
Amazon Managed Service for Prometheus (which may sometimes be referred to as AWS Prometheus) is a fully managed, Prometheus-compatible monitoring and analytics offering from AWS that enables users to readily consume Prometheus capabilities, including the use of PromQL query language to monitor containerized applications at scale.
How do I use Prometheus with AWS?
AWS customers can deploy a native Prometheus solution offering on EC2 or Amazon EKS. Customers can also consume the Amazon managed service for Prometheus in the regions where it is currently available without the need to manually deploy and configure the Prometheus infrastructure.
What is Prometheus monitoring?
Prometheus scrapes metrics from jobs or services and stores them as time series data for post analysis and visualization on the Prometheus server. This data can then be queried and analyzed using the query language PromQL by users who can perform functions such as select, filter, aggregate, etc. to analyze this data for monitoring or troubleshooting as well as alerting purposes.
