Share
Azure Monitor is a cloud platform that enables you to collect and analyze telemetry data from cloud and on-premise applications and services. Azure monitoring can help organizations identify issues and respond accordingly.
In this post, we’ll explain key Azure Monitor logging concepts and best practices. We will also show how NetApp Cloud Insights can help you easily manage and visualize Azure logging data. Cloud Insights enables you to centralize monitoring and troubleshooting across multicloud and hybrid environments, providing the kind of visibility that helps you reduce issues while saving costs.
In this article, you will learn:
- What is Azure Monitor
- What are Azure Monitor logs
- Azure Monitor Logs architecture
- Azure logging best practices
- Azure logging with NetApp Cloud Insights
What Is Azure Monitor?
Azure Monitor is a service that you can use to collect and evaluate telemetry data from your applications and services on-premises and in the cloud. The service collects both metrics and log data and integrates a variety of utilities for visualization, analysis, and response. You can use Azure Monitor data to measure your application and service performance and identify issues or opportunities for optimization.
Below is a diagram of the utilities Azure Monitor contains and how those utilities are applied to collected data.
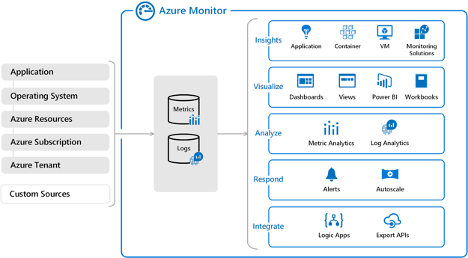
Image Source: Azure
Learn about first-party and third-party Azure monitoring services in our guide: Azure monitoring tools .
What Are Azure Monitor Logs?
Logs are the primary source of data for analysis in Azure Monitor. These logs are collected from a variety of sources and include both numeric and text data. Depending on the sources ingested, these logs can vary widely in their contents and may represent a range of data structures and time intervals.
The most common type of log entry is event data. Applications or services create these entries when an event occurs. For example, a user action or when a threshold is met. Event logs provide information about the event, including what the event was, what triggered it, and any users involved. Applications and services often create custom logs to accommodate the specific data and data structure needed.
Azure Monitor Logs Architecture
When Azure Monitor Logs collect data, it is aggregated in a workspace in Log Analytics (more about this below). In each workspace, each log type has a table for storing data. Tables properties are defined by the type of data it stores, although some properties are shared.
The exception is log data from Application Insights. Each monitored application is assigned a standardized set of tables in this service, including for exceptions and application requests.
Although data is stored slightly differently, both Log Analytics and Application Insights are based on the same engine, the Azure Data Explorer. This means you can create cross-resource queries that combine log and application data. You can also query across applications or workspaces.
Below is a diagram that outlines how data is distributed to Log Analytics vs Application Insights. You can also see example queries for retrieving that data.
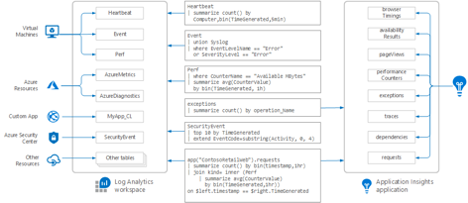
Image Source: Azure
Learn how Azure metric alerts and Azure log alerts work in our guide: Azure monitoring alerts .
Log Analytics workspace
The workspaces available in your Log Analytics service depend on the data sources you are using. When you add sources, you define the workspace or workspaces that are used for each source.
You can then use these workspaces to collect data from activity logs, resource logs, and logs from other monitoring solutions. For example, you can ingest log data from both Azure Sentinel and Azure Security Center.
When you add a workspace to Log Analytics, a standard set of tables is automatically added. Then, as you add different sources and services, new tables are created as needed. You can also manually create tables through calls to the Data Collector API.
Azure Logging Best Practices
When setting up log collection in Azure, you can apply several best practices to ensure you are collecting relevant and accessible data. Below are some practices to consider relating to general logging and instrumenting your applications.
Instrumenting an application
To effectively monitor applications, you need to include instrumentation. Instrumentation is code that you include in your application to collect data and write to trace logs. By instrumenting applications, you enable data collection during operations and eliminate the need to perform it manually.
When instrumenting your applications, you should try to categorize your logs by separating trace data into different logs depending on component functionality or operation. This categorization enables you to locate and filter log data more quickly and limit the amount of data you need to parse. You should also make sure to separate data by security requirements to ensure that sensitive data remains protected.
General application logging practices
When logging application data you need to track control flows throughout your code. This includes logging the entry and exit times of methods. For example, when logging entry methods you can collect traces that provide the method name, parameter values, and time.
You should make sure to log any warnings or exceptions that occur, including nested ones. When you define traces for these issues, you want to identify associated users and any correlated activity information.
You should also make sure to log any resource access attempts. This includes attempts to access files, databases, and message queues. In combination, you can then use this data for auditing or metering purposes.
In addition to the above practices, the following tips can help you ensure that your logging is as effective as possible:
- Logs should be easy to read and parse—using structured data is helpful. You should also make sure that logged data is descriptive but concise.
- Use consistent timestamps—this includes using the same format and timezone, with the timezone indicated.
- Don’t let logging block operations—logging should be transparent with the exception of events that indicate issues or may impact operations. If an event is not critical, it should be logged silently.
- Eliminate logging dependencies—logging should be extensible and should not depend on concrete targets. One way to ensure this is to use a tool like ILogger, which can expose logging methods for ingestion.
- Ensure that logging is failsafe—log operations should not throw exceptions or trigger cascading errors.
Learn three methods you can use to visualize metrics and log data in our guide: Azure monitoring dashboard .
Azure Logging with NetApp Cloud Insights
NetApp Cloud Insights is an infrastructure monitoring tool that gives you visibility into your complete infrastructure. With Cloud Insights, you can monitor, troubleshoot and optimize all your resources including your public clouds and your private data centers.
Cloud Insights helps organizations reduce mean time to resolution by 90%, prevent 80% of cloud issues from impacting end users, and reduce cloud infrastructure costs by an average of 33%. It can even reduce your exposure to insider threats by identifying risks to sensitive data.
In particular, NetApp Cloud Insights lets you automatically build topologies, correlate metrics, detect greedy or degraded resources, and alert on anomalous user behavior. With NetApp Cloud Insights, you can use Azure logging data to optimize cloud costs and save money by identifying unused resources and right-sizing opportunities.