Share
What Is Azure Cost Analysis?
Cost analysis is key to understanding resource usage and spending across your environment. Azure Cost Analysis is a free tool that provides visibility into your Azure cloud spending patterns. This information is critical to properly controlling and optimizing Azure costs. You can learn how much money each service costs, and how it serves your overall environment.
Cost Analysis can help you explore and analyze your cloud spending. Once the analysis is complete, you can view aggregated costs, learn where costs are accrued and identify Azure spending trends. You can also see accumulated costs over time and use this information to estimate quarterly, monthly or yearly cost trends against a certain budget.
This is part of our series of articles about Azure cost management.
In this article:
- Common Cost Analysis Uses
- Explore and Analyze Costs with Cost Analysis
- Azure Cost Optimization with NetApp Cloud Volumes ONTAP
Azure Cost Analysis: Common Use Cases
Here are some typical applications for Azure Cost Analysis.
View Predicted Costs
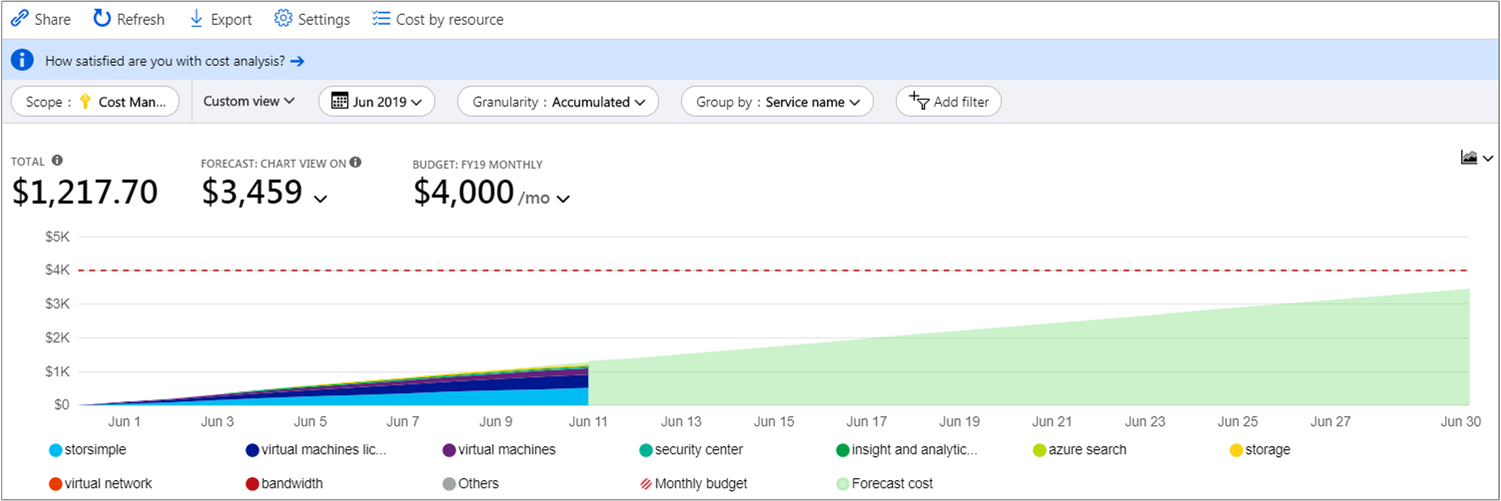
You can view forecasted costs in the cost analysis area, using the stacked column view. Each forecast is based on historical resource use. This means that any changes to resource use will affect the predicted costs.
The default view includes a top chart with the Actual/Amortized cost section and a forecasted cost section. In the chart, the solid color shows the Actual/Amortized cost, while shaded colors show your predicted cost.
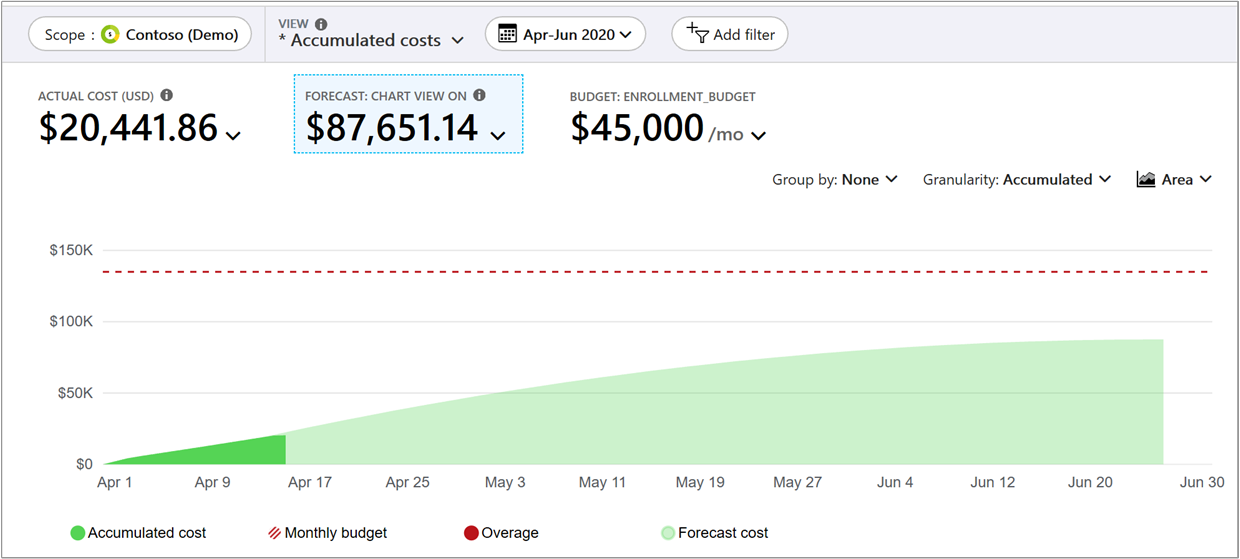 Image Source: Azure
View Breakdown of Costs by Service
You can view costs for each Azure service you use. This can help you understand which parts of the infrastructure cost the most. For example, your virtual machine (VM) costs may be small. However, you can accumulate significant networking costs due to the amount of information emitted from your VMs. By understanding your primary cost drivers of each Azure service, you can adjust service usage and optimize costs.
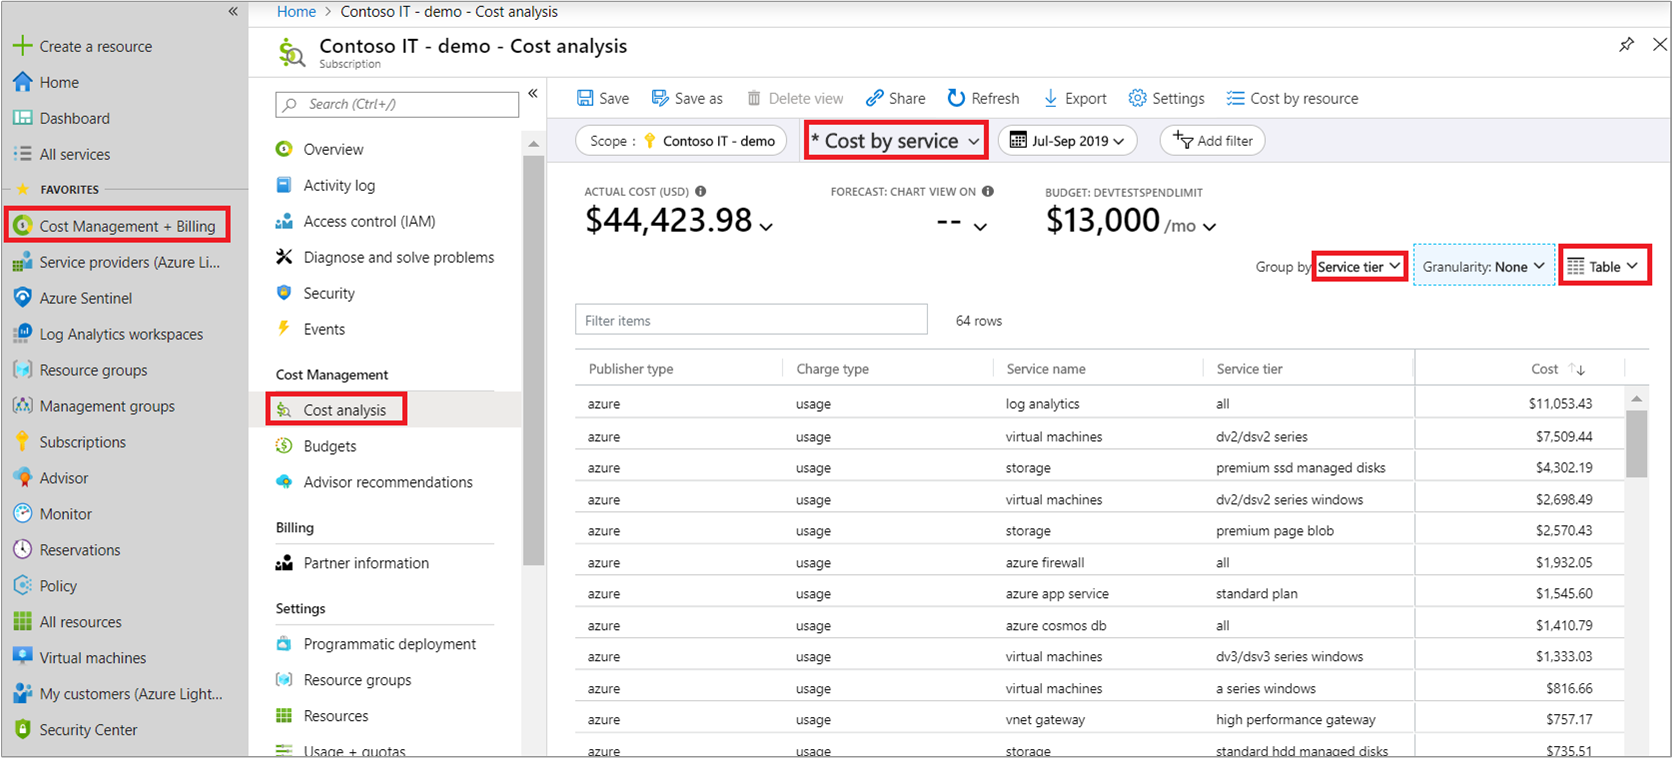 Image Source: Azure
View Breakdown of Costs by Resource
Azure resources are used to build services. You can review costs according to resources and quickly identify the primary cost contributors. This view can help you learn if a service has expensive resources. You can then consider what changes to do to reduce your costs.
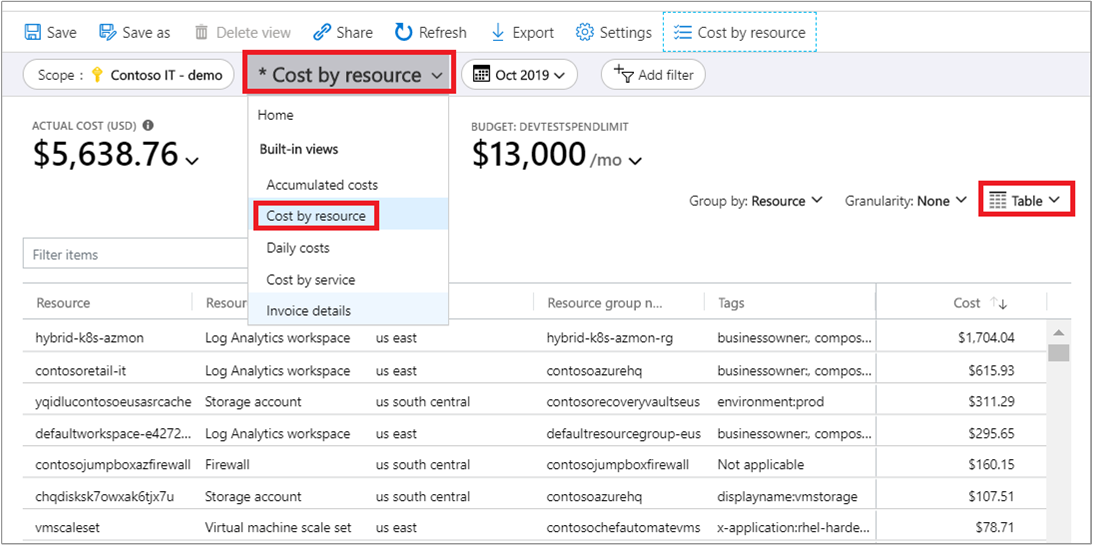 Image Source: Azure
Related content: Read our guide to Azure cost optimization
Exploring and Analyzing Costs with Cost Analysis
The following is an outline of how you can use Azure Cost Analysis.
Accessing Cost Analysis
To access the Azure Cost analysis interface:
- Go to the Azure portal and select your subscription or the scope for which you want to view costs. You can switch to a different scope using the scope pill.
- From the menu, select Cost analysis.
Review Costs
Note that the scope you choose will be used across the Cost Management interface. It is not possible to select multiple scopes. However, you can choose a larger scope that others can roll up to. You can then filter down to the required nested scopes.
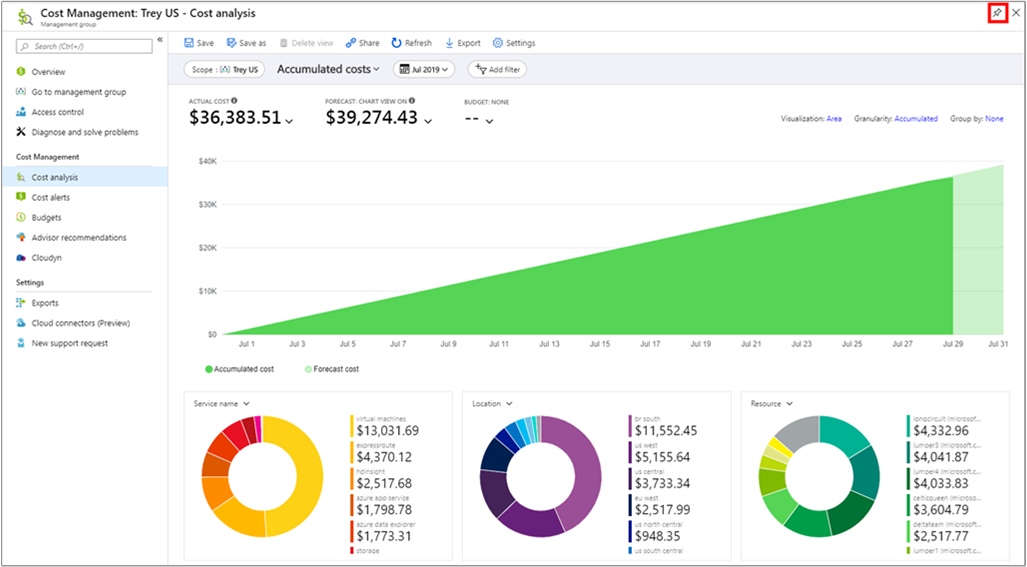
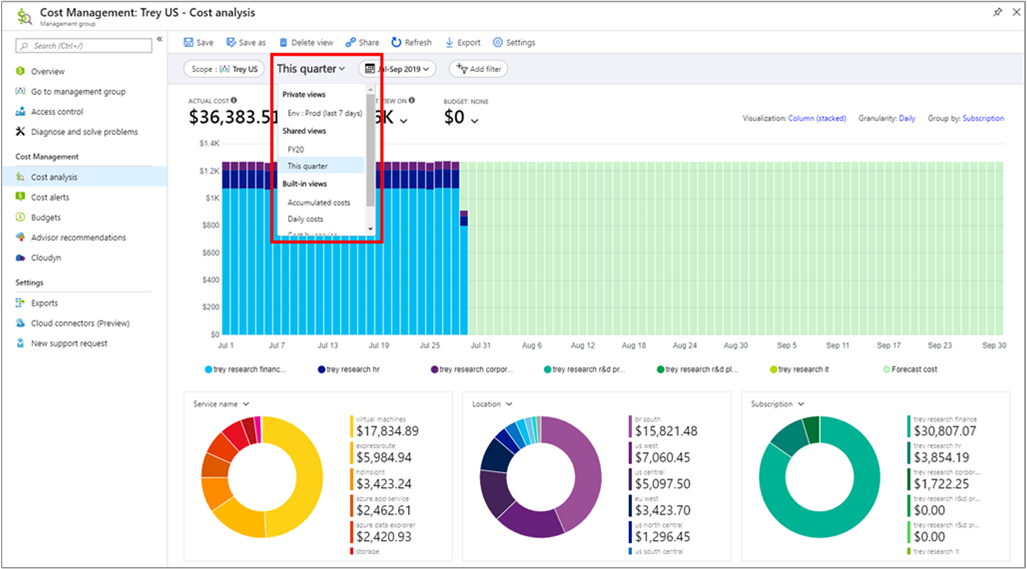
Here are key areas included in the initial cost analysis view:
- Accumulated cost view—a view of your predefined cost analysis, which displays total costs for the current period, by default. Each of these views includes a date range, group, filter settings and granularity. You can change the default to see other built-in views.
- Actual cost—the total purchase and usage costs as accumulated in the current month. This is the cost you will see on your bill.
- Forecast—the total forecasted costs for a time period of your choice.
- Budget—displays a planned spending limit for a selected scope, when available.
- Accumulated granularity—the total aggregated daily costs, starting from the beginning of your billing period. After creating a budget for a subscription or billing account, you can view your spending trends. You can hover over a certain date to see the accumulated cost for that period.
- Pivot (donut) charts—dynamic pivots that break down your total costs. To change pivot charts, simply select a different pivot. You can modify this view at any time. Charts categorize costs according to service (meter category), child scope, and location (region) by default.
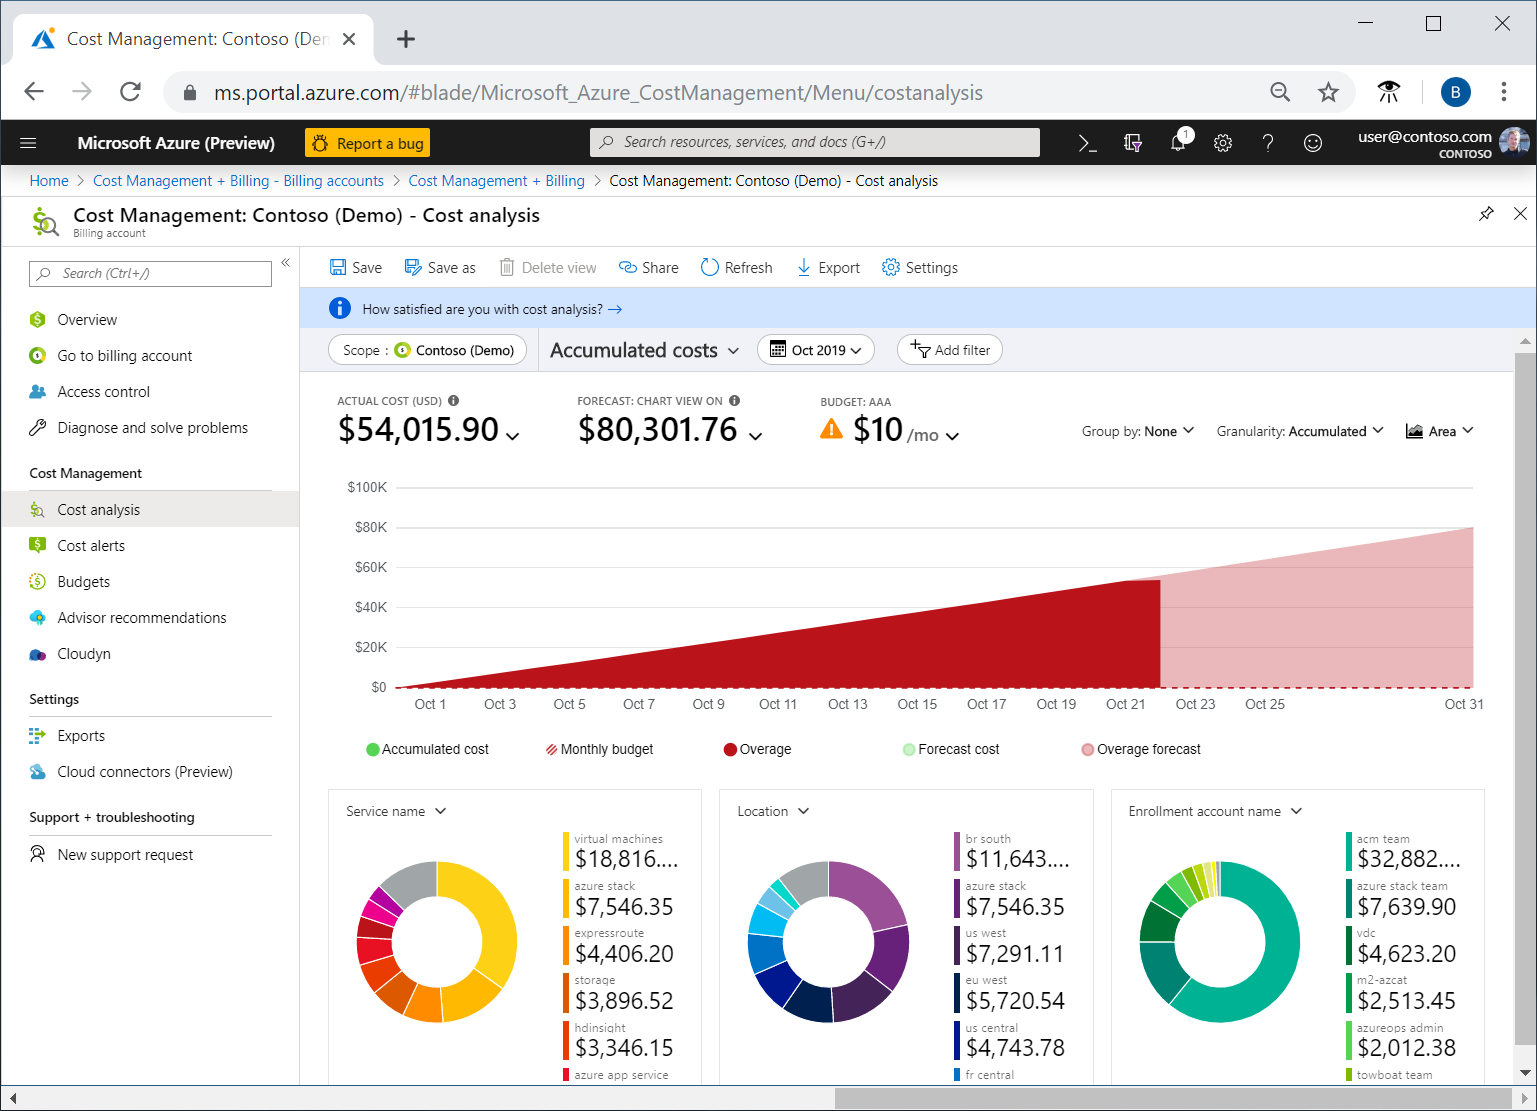 Image Source: Azure
View Actual and Amortized Costs
Here is an example of a graph displaying Azure costs for the current month:
 Image Source: Azure
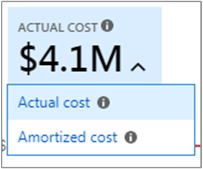
By default, cost analysis displays the Actual cost, which includes all accumulated purchase and usage costs. The actual cost will be shown on your invoice, which is why this view is ideal for reconciling the invoice.
You might find purchase spikes, as displayed in the actual cost, alarming when monitoring spending anomalies and changes in cost. You can flatten spikes that are caused by reservation purchase costs. To do this, switch to Amortized cost.
 Image Source: Azure
The Amortized cost view breaks down your reservation purchases into several daily components, and then spreads these parts over the duration set for the reservation term. For example, instead of displaying a $1200 purchase on January 1, it displays a $100 purchase every day starting from January 1 and until December 31.
This view provides more than basic amortization. It reallocates costs and associates them by using the resources that made use of the reservation. For example, if the $100 daily charge was split between 2 VMs, the view displays two $50 charges per day. If the reservation was not used during the day, the view displays one $50 charge, which is associated with the relevant VM. In this case, it also displays another $50 charge, which is categorized as UnusedReservation. You can see unused reservations only when viewing your amortized costs.
Since costs are represented differently, your actual cost view and amortized cost view will display different totals. The total cost of months using a reservation purchase typically decreases when you view amortized costs. Months following a reservation purchase typically increase. You can use amortization only for reservation purchases. This option is currently not available for Azure Marketplace purchases.
Customize and Share Views
You can easily customize views in cost analysis. Here is a quick rundown:
- Choose a date range
- Group the data to view a breakdown
- Choose a visualization option
- For quick access, Pin the view to a dashboard
- To save your customized views, select Save
 Image Source: Azure
You can share the dashboard and allow other users to track costs from one place. Alternatively, you can share a direct link to a customized view. Users can then copy and personalize the view. You can share a link to a view by selecting Share.
Here are several important aspects to note:
- Users with Cost Management Contributor access or greater are allowed to create shared views.
- It is possible to create a maximum of 50 shared views per scope.
- All users can save a maximum of 50 private views, including users with only read access. However, you can share these views with others directly through cost analysis. What you can do is pin the view to a certain dashboard or share the URL of the view. Other users can use the URL to save a copy.
- All created views can be accessed from the view menu.
- The view menu first shows the private views of the users, and then the views shared across the scope. Built-in views are always available and are displayed after all other views.
 Image Source: Azure
Export Cost Data
Here is how to create a daily export of your usage and cost data:
- Go to Subscriptions and choose a subscription from the list
- Go to the Cost Management category in the menu and choose the Cost analysis option
- Go to the top of the Cost analysis pane and choose the Settings option
- Go to the Configuration pane and choose Exports
- Choose an export option, such as Schedule export
In addition to subscriptions, you can also create exports on accounts, resource groups, enrollments and departments.
- Enter a descriptive name for your export
- Go to Export type and choose Daily export of month-to-date costs. You can now choose a start date
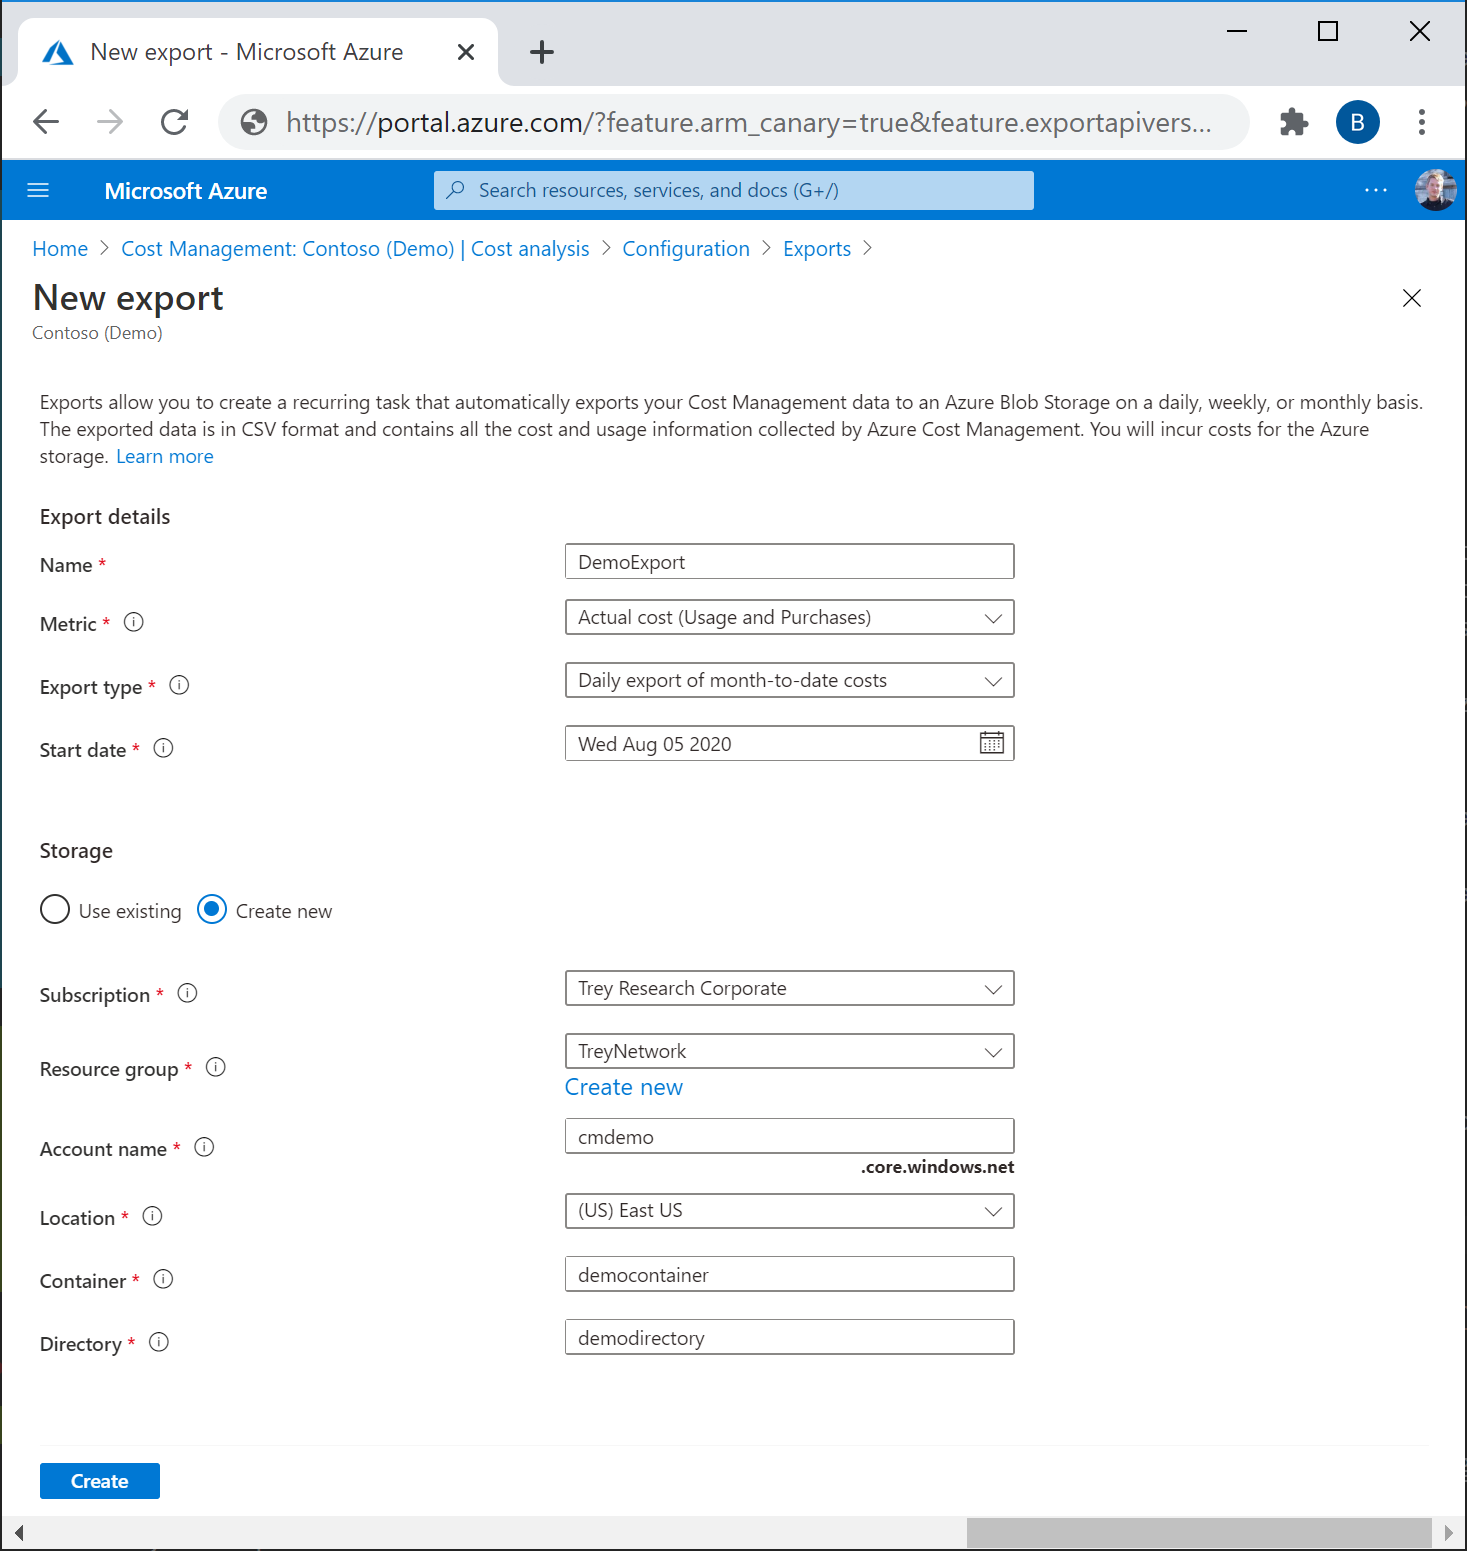 Image Source: Azure
- Define a subscription for your Azure storage account and then choose your storage account
- Define a storage account and a storage container
- Define the directory path you want the export file to go to
- If needed, you can create a new resource group, a new storage account, and also choose a storage account region. You can do this by choosing Create new
When done, a new export will appear in your list of exports. New exports are enabled by default. You can disable or delete your scheduled export by choosing any item from the list, and then selecting Disable or Delete.
Azure Cost Optimization with NetApp Cloud Volumes ONTAP
NetApp Cloud Volumes ONTAP, the leading enterprise-grade storage management solution, delivers secure, proven storage management services on AWS, Azure and Google Cloud. Cloud Volumes ONTAP capacity can scale into the petabytes, and it supports various use cases such as file services, databases, DevOps or any other enterprise workload, with a strong set of features including high availability, data protection, storage efficiencies, Kubernetes integration, and more.
In particular, Cloud Volumes ONTAP provides storage efficiency features, including thin provisioning, data compression, and deduplication, reducing the storage footprint and costs by up to 70%.
Learn more about how Cloud Volumes ONTAP helps cost savings with these Cloud Volumes ONTAP Storage Efficiency Case Studies.

