Share
Large scale cloud provider outages are a part of life today. Whether it’s a Google Cloud outage that caused disruption to many social networking services or a Microsoft outage that gifted many of us an email-free day earlier this year, everyone at one point or another has been affected by “that time the internet broke”.
Running reliable systems and maintaining the underlying cloud or physical infrastructure requires end-to-end visibility and incident-management workflows. It’s crucial to understand performance bottlenecks and constantly monitor the uptime of your business-critical services, ideally in real time.
Nowadays, many companies are hybrid cloud or plan to exit their data centers due to rapid growth. This creates some interesting opportunities in terms of monitoring and logging. Even if your enterprise IT teams have already adopted a cloud-ready modern monitoring stack, you may still have legacy concerns, a move to cloud doesn’t necessarily mean you can shut all of your datacenters. So how can legacy infrastructures and new monitoring and logging tools work together?
In this article, we’ll take a look at how monitoring and logging have shifted in the cloud era. We’ll also discuss the changes you should make to your approach when it's time to move to the cloud, and how to maintain consistency when running a hybrid-cloud environment.
Monitoring and Logging before the Cloud Era
Before the cloud era began, traditional on-premises monitoring was complex, especially when setting up and integrating all systems together. This often resulted in high costs, as well as months, or even years, of effort—with no complete solution in the end.
Moreover, larger IT disasters could also lead to monitoring-solution failures that resulted in a complete lack of visibility into what was happening, exposing potential problems to customers. On the other hand, self-hosted monitoring provided better data security and retention, offering more flexibility in using free open-source technologies.
During the last couple of years, monitoring and logging approaches have changed significantly. Enterprises are adopting monitoring solutions focused on cloud-native architectures, which don’t only store data and trigger traditional alerts, but also scrape metrics and provide a rich query language that is more suited to modern native-cloud applications.
Monitoring and Logging in the Cloud Era
Today, in the cloud era, workloads are more distributed, and organizations are focusing on cloud-native architectures. They’re also concentrating on development based on containerization technologies like Docker and Kubernetes, where the monitoring approach is completely different than monitoring on-premises environments to accommodate the dynamic and ephemeral nature of containers.
Take Netflix, for example. As mentioned in Lessons from Building Observability Tools, Netflix’s cloud infrastructure growth forced them to revisit concepts like analysis of metrics, data persistence, and crucially tailoring their monitoring user interfaces for different user groups. Collecting and storing all of the metrics is of little use if you can’t present them in such a way that users can take action based on them.
In a cloud-native world, the traditional monitoring stack simply can’t provide enough insights into our systems and infrastructure due to the large amount of data generated by so many moving parts.
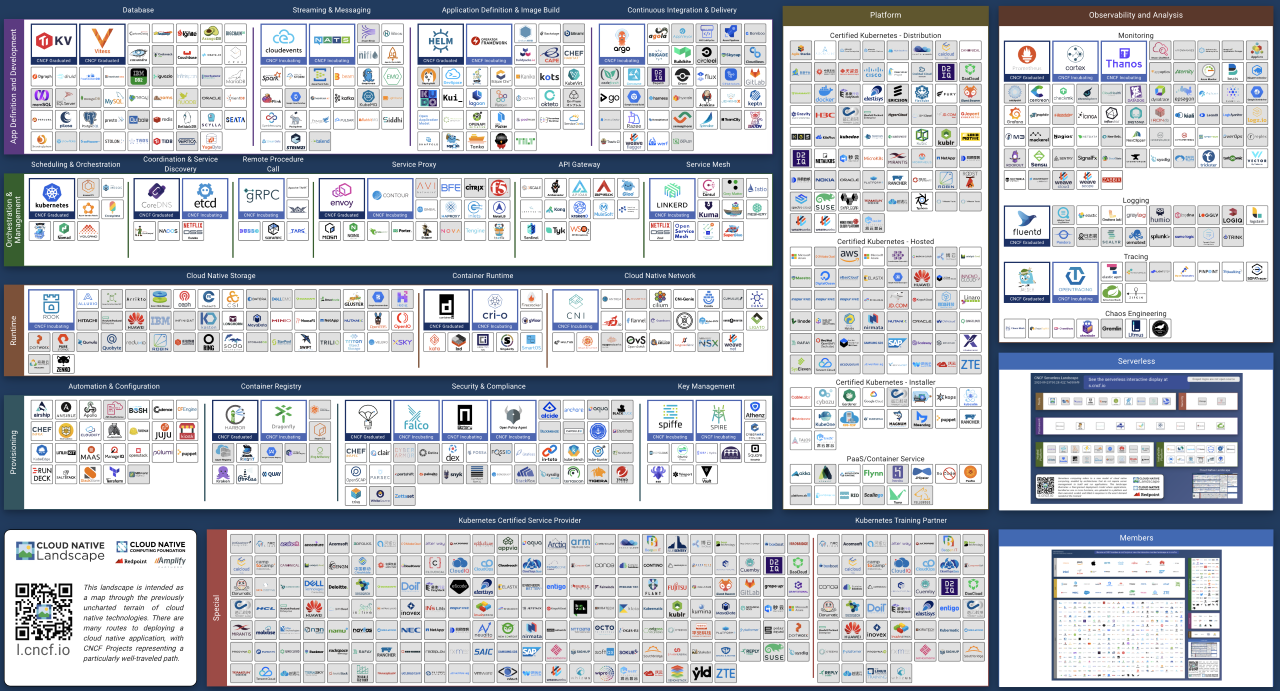
How many moving parts? Well one look at the CNCF Cloud Native Landscape can answer that in a word: lots...
But at least the cloud removes some of the legacy moving parts in the process. Monitoring in the cloud can eliminate the need for:
- Tracking underlying hardware failures
- Capacity planning (though prudent cloud users should still perform budgeting!)
- Managing the monitoring much of the monitoring solution itself
Of course, there are a lot of monitoring tools out there, and many experts still want to use certain tools for certain problems. Effective monitoring ensures that you track the right key business metrics and do not overcomplicate your dashboards with meaningless indicators. Let’s review how NetApp Cloud Insights solved this problem.
Getting the Most out of Monitoring
There are many new signals for monitoring applications in the cloud, but we learn from Netflix above that not everyone wants to know all of them. And while everyone has their own signals to keep track of, you really need a tool that understands these signals in different formats and aggregates them all to see how they feed into KPIs that are end-user facing.
The image below shows the status of Kubernetes deployments using NetApp Cloud Insights, which allows you to monitor, troubleshoot, and optimize all your resources, including your public clouds and private data centers.
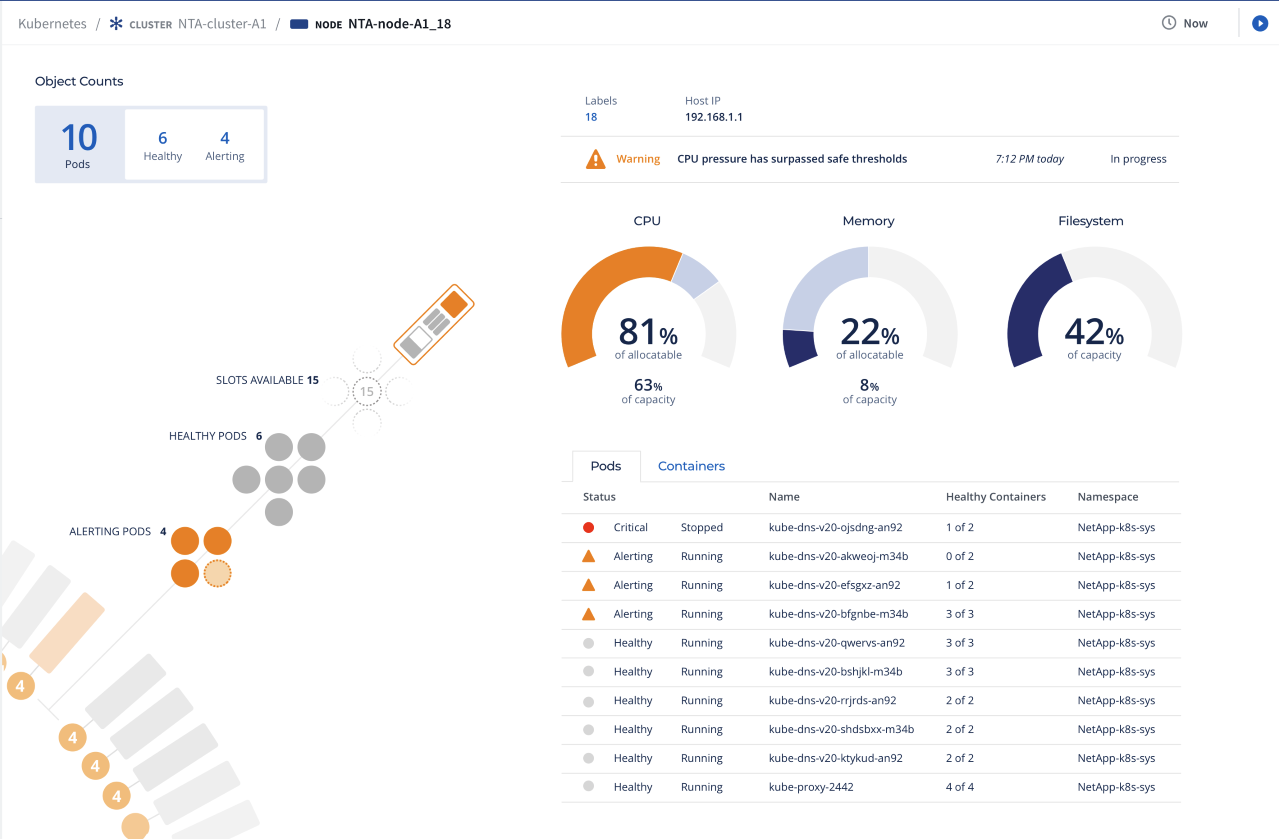
The status of Kubernetes deployments using NetApp Cloud Insights
NetApp Cloud Insights is simple to use. It’s a SaaS solution hosted in the cloud, so you don’t have to worry about the maintenance of your monitoring stack. It also provides real-time data visualization of the topology, availability, performance, and utilization of all your infrastructure. Of course, it includes support for NetApp Cloud Volumes, NetApp HCI, and NetApp AFF.
NetApp Cloud Insights focuses on the following:
- Improving customer satisfaction by preventing cloud infrastructure issues before they affect end users.
- Proactively preventing failures and reducing the time taken to triage issues, often the largest part of incident resolution.
- Optimizing and reducing cloud infrastructure utilization by identifying under and over-user resources, allowing engineers to do more with less.
Conclusion
Beyond what we’ve covered in this article, there are many other ways to monitor your cloud infrastructure. However, most of the important aspects to consider regarding your monitoring strategy stay the same, both with cloud and on-premises environments. Cloud Insights helps deliver on the following key principles:
- Keep monitoring data in a single place: Keeping data in one place allows you to easily visualize your key metrics across different environments on a single monitoring dashboard. Moreover, alerting workflows use the same data format, even if you use some third-party monitoring tools.
- Take advantage of centralized monitoring: When using centralized monitoring, you can benefit from advanced query patterns, dashboards, and built-in alerting mechanisms.
- Use common incident-management workflows: Incident and change management are structured approaches used to ensure that fixes and changes are thoroughly and smoothly implemented—with a focus on the wider impacts of the incident or change. Consistent incident/change-management workflows help ensure that you are notifying your on-call engineers in the most efficient way possible and keeping track of visibility in terms of how many incidents occurred (including all environments).
- Integrate all tools into your monitoring pipeline: Invest in both your development and operations teams’ efforts to integrate monitoring into a single pipeline. With better automation, introducing new changes becomes faster and more flexible.
To learn more about how NetApp CI can monitor, optimize, and secure your hybrid infrastructure, contact us or visit our blog.