Subscribe to our blog
Thanks for subscribing to the blog.
July 30, 2019
Topics: Cloud Volumes ONTAP Master3 minute read
There are a number of different cloud monitoring tools that can be used when you deploy Cloud Volumes ONTAP. One such tool is NetApp’s Active IQ Unified Manager, which provides detailed reporting and alerting of Cloud Volumes ONTAP health, capacity, and performance.
In this article we’ll take a screen-by-screen look at this free on-premises and cloud performance monitoring tool for Cloud Volumes ONTAP that’s native to the NetApp storage ecosystem.
Cloud Monitoring with Unified Manager
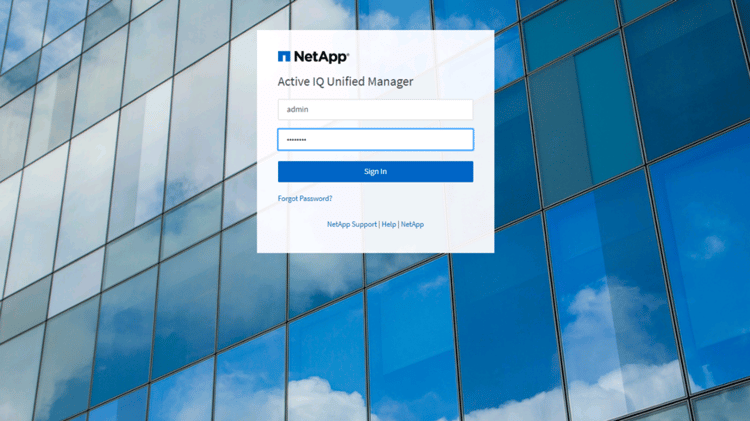
The first step to monitoring cloud infrastructure with Cloud Volumes ONTAP is to sign-in to Unified Manager. Below you can see the sign-in screen.
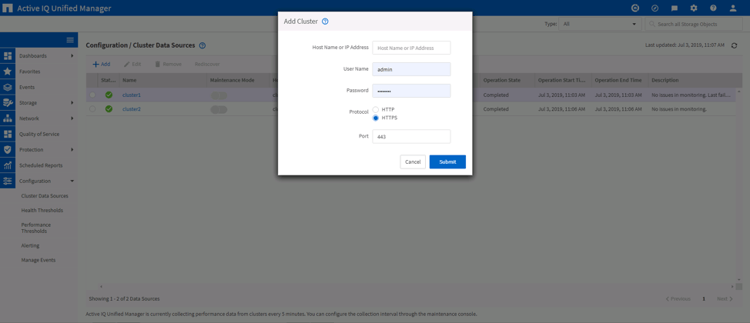
Unified Manager allows you to monitor multiple clusters from a single console. You add clusters by specifying the cluster management IP address or host name of the cluster. All the information that you need to enter is the hostname or IP address, your user credentials, the protocol that you are using (HTTP or HTTPS), and the port that you will expose.
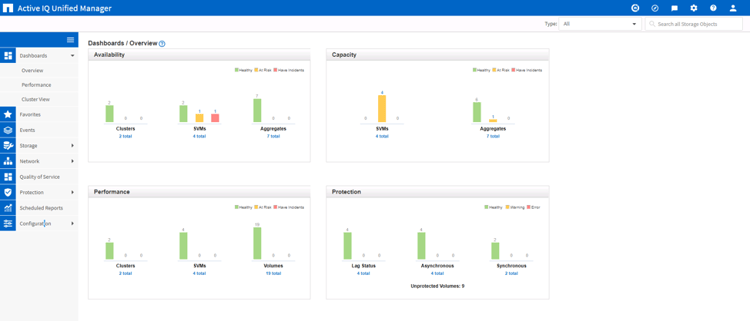
Unified Manager allows you to monitor the health and performance of your clusters. A number of dashboards are used to summarize this information. The Dashboards Overview gives you a general view of all the dashboards: Availability, Capacity, Performance, Protection. Below each of these summary dashboards, you’ll also be given a list of critical unresolved incidents and risks associated with these specific categories.
Here is a closer look at the Performance dashboard. You’ll be able to see the average IOPS and MBps for all the events that have occurred on the cluster over a 72-hour period, as well as the latency and utilization rates.
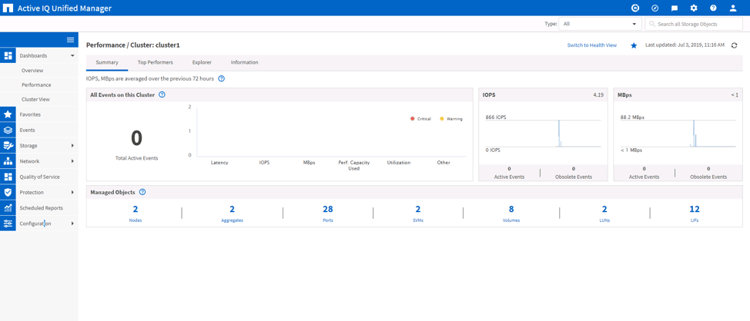
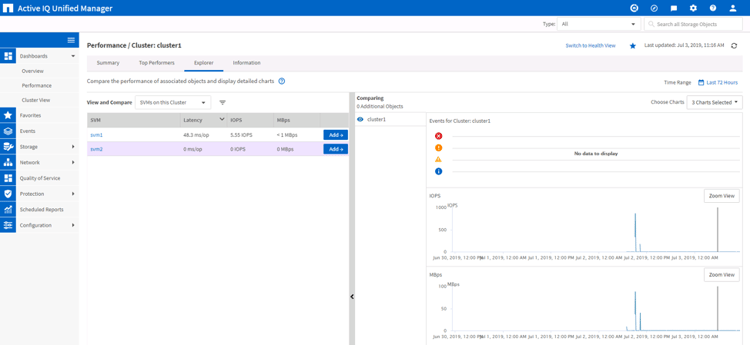
Moving over to the Explorer tab in the Performance dashboard, you can compare the performance rates of associated objects.
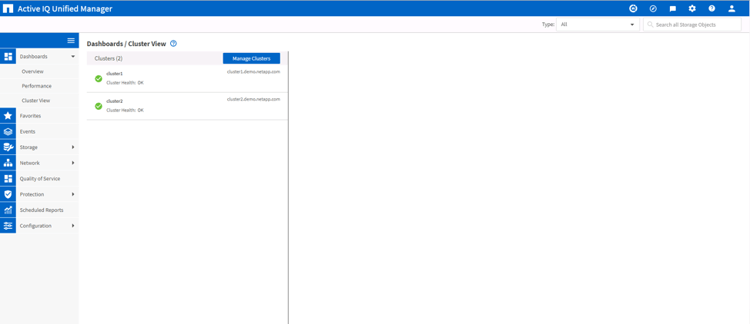
In the Cluster View dashboard, you can find the clusters located in each separate environment:
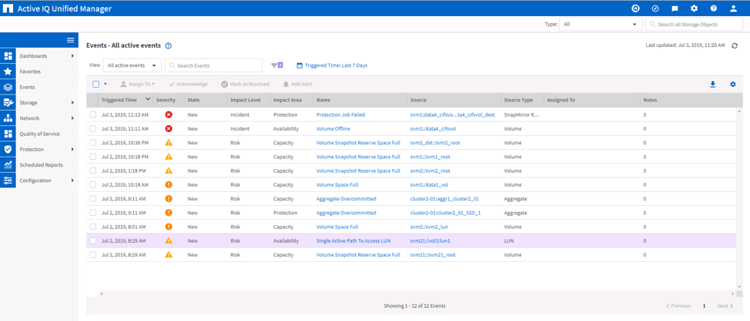
Unified Manager also allows you to monitor and manage cluster events. Here you’ll be able to pinpoint any risks or incidents that could endanger the cluster and which area of operation the events are impacting.
Some examples of this would be any failures that occur with SnapMirror, as well as any lag in SnapMirror performance, volume restore failures, problems during failover, etc.
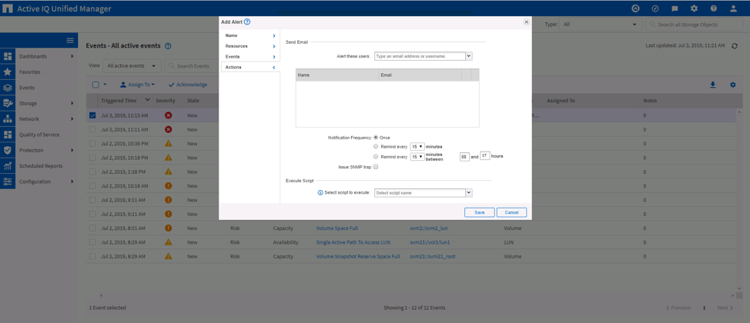
From this tab, administrators can create email alerts based on specific types of events. This will make sure that trouble events can be headed off before they cause too much damage.
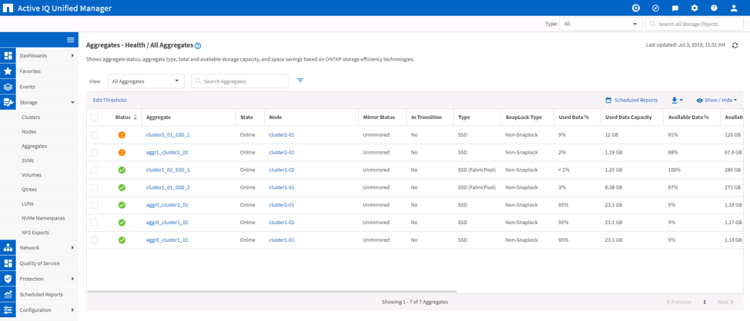
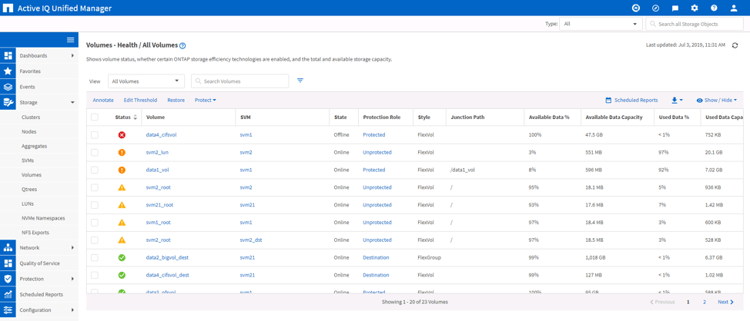
Unified Manager makes it easy to find and solve health issues for clusters, SVMs, and storage aggregates and volumes. These views can be filtered by type, i.e. Critical, Error, etc., as well as searched for specific information.
Aggregates Health View:
Volumes Health View:
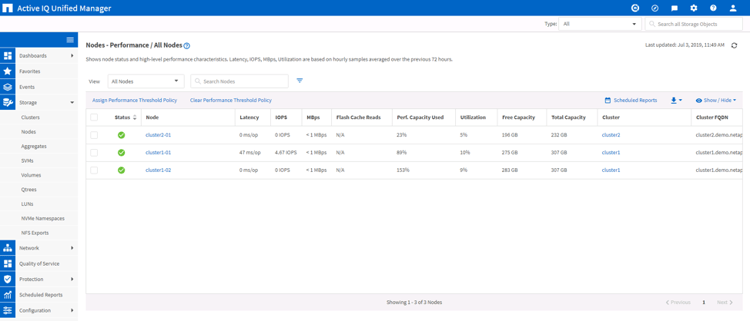
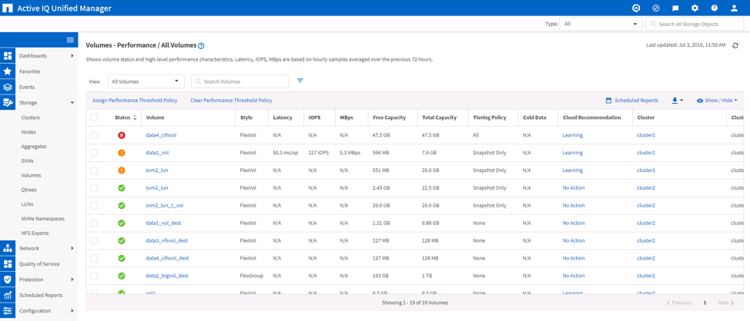
Unified Manager allows users to find detailed performance information about clusters, nodes, and other storage elements, including information related to latency and IOPS. This gives users a way to easily detect and solve storage related performance issues. These performance views are available under Clusters and Nodes in the storage menu.

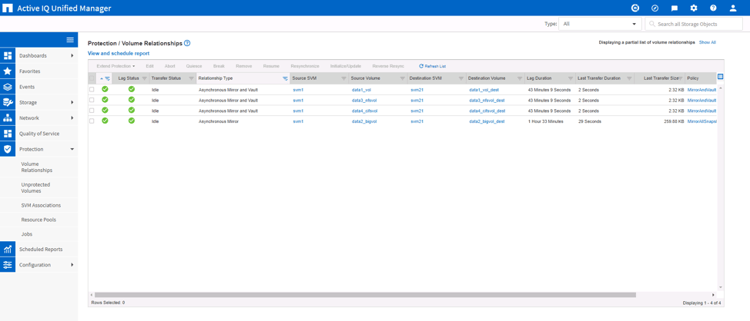
Unified Manager also helps you ensure that data protection through SnapMirror® is working correctly:
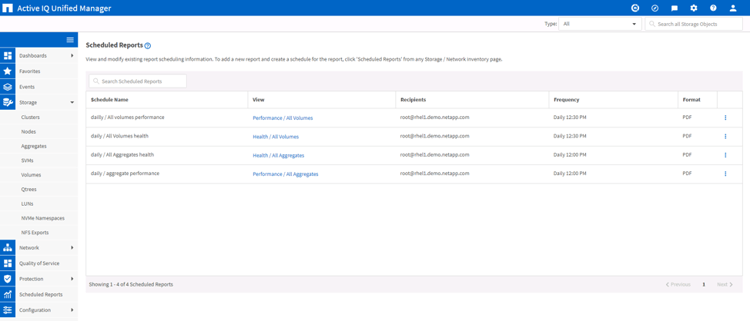
In the Scheduled Reports page, Unified Manager gives you the ability to view and modify existing report scheduling information. Various types of health and performance reports can be created for any element. To add a new report and create a schedule for the report, click “Scheduled Reports” from any Storage, Network, Data Protection, or Quality of Service inventory page.
These reports can be executed on a schedule and delivered through email for periodic reporting. The format of the report can be set as either PDF or CSV formats, and can be sent in hourly, daily, weekly, or monthly time intervals.
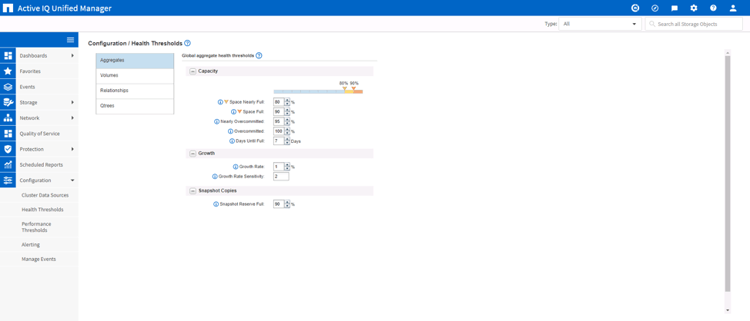
You can also set up health and performance thresholds which will generate alerts and global events. Separate thresholds can be set for aggregates, volumes, and relationships.
Summary
Active IQ Unified Manager is a handy cloud monitoring solution provided by NetApp that is absolutely free of charge. With Unified Manager, users get a centralized interface for on-premises, cloud-based, and hybrid cloud monitoring of ONTAP storage environments, including Cloud Volumes ONTAP deployments on AWS and Azure.
With the ability to set up alerts, notifications, and thresholds for capacity and performance for volumes on AWS, Azure, and GCP, Unified Manager is an indispensable resource for any storage / IT administrator.
If you’re already using the cloud, try monitoring cloud infrastructure with Unified Manager.

