Share
[Note: This blog has been refreshed to reflect updated performance figures.]
NetApp and Google Cloud are proud to bring you Cloud Volumes Service for Google Cloud. This blog focuses on identifying the envelope of the service—that is, what you can expect from your enterprise application when it’s built on this new and robust cloud-native NAS storage service.
This introductory blog focuses generically on the category of enterprise applications that require a Linux file service; let’s call it Enterprise App X. Enterprise App X is a scale-out custom application that relies heavily on NFSv3 to provide each of the many compute instances access to one or more shared filesystem resources. (SMB is available too and is covered in the blog “Windows Applications on Google Cloud Platform”). As the application architect, you’re not quite sure about the I/O needs, except that they are large and distributed. To understand the I/O needs, let’s explore what the NetApp® Cloud Volumes Service is capable of, by answering the following questions:
- How many IOPScan Application X generate against a single cloud volume?
- How much bandwidthcan Application X consume against the same volume?
- How much bandwidth can a single instance running Application X consume?
- What regional differences are observed?
The results documented below come from fio summary files. fio is a command line utility that was created to help engineers and customers generate disk I/O workloads to be used for validating storage performance. We used the tool in a client-server configuration using a single mixed master/client and 32 dedicated client GCE instances—thus scale out.
The tests were designed to identify the limits that the hypothetical Application X may experience as well as expose the response time curves up to those limits. Therefore, we ran the following scenarios:
- 100% read, 0% write
- 90% read:10% write,
- …
- 10% read, 90% write
- 0% read, 100% write
64KiB Sequential: - 100% read, 0% write
- 90% read:10% write,
- …
- 10% read, 90% write
- 0% read, 100% write
Volume-Level Bandwidth
Volume network bandwidth is based on a combination of service level and allocated capacity. However, the total bandwidth available to all volumes is potentially constrained by bandwidth made available to the project. Bandwidth calculations work as shown in the following table.
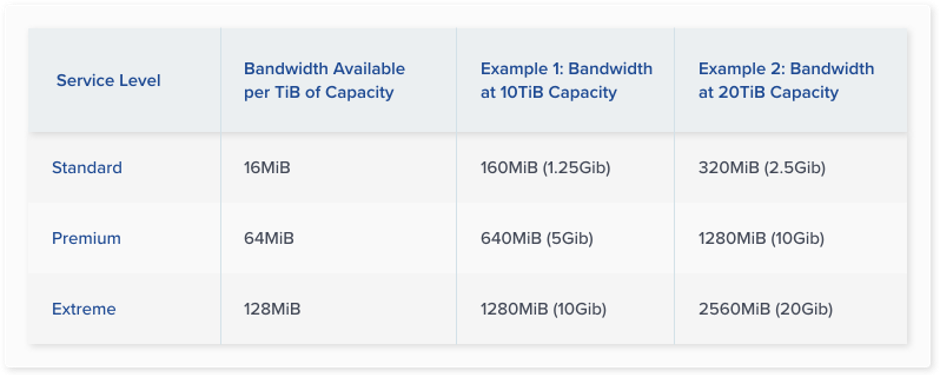
For example, although two volumes allocated 10Gbps of bandwidth each may both operate unconstrained, three volumes allocated 10Gbps each are constrained by the project and must share the total bandwidth.
Test Results
NFSv3 Scale Out Workload: Random I/O
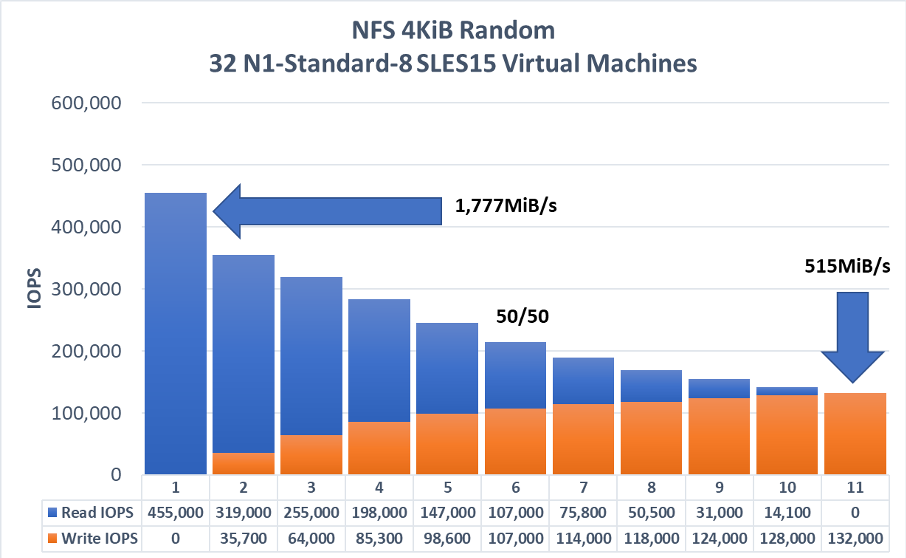
The following graph represents the upper limits of I/O for a single cloud volume. Driven by fio from 32 N1-Standard-8 SLES15 GCE instances, anywhere from 460,000 4KiB random read iops to 135,000 4KiB random write iops are achievable.
When reading the graphs, please understand that the left most bar represents a 100% read workload, the right most bar a 100% write workload and every other bar from left to right a 10% decrease in read/10% increase in writes. For ease of reading, the graph is marked with a 50/50 tag in its center indicating the 50% read / 50% write split.
NFSv3 Workloads: Throughput
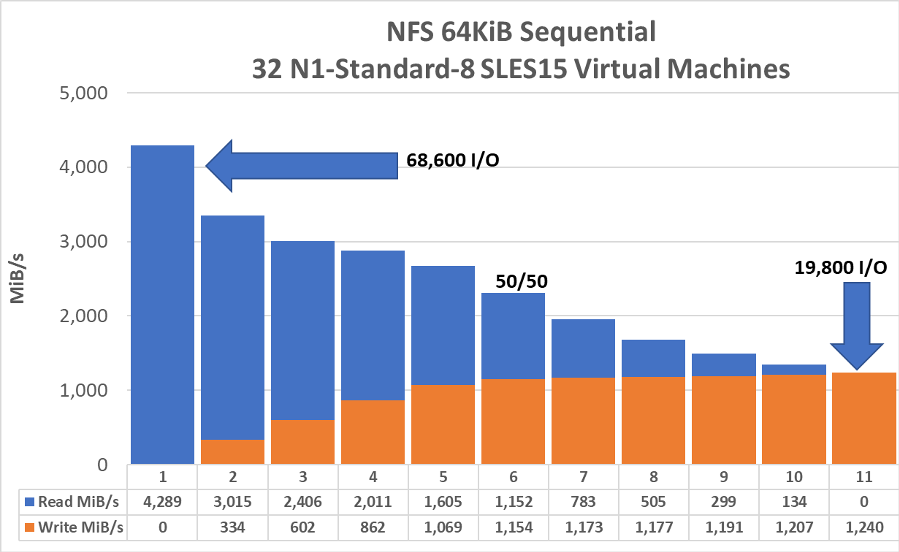
While the previous graph documents the random I/O potential of a single cloud volume, this next graph does the same for sequential workload. The tests were run in a similar manner running fio from 32 GCE instances.
Whereas the previous version of this papers reported the bandwidth available to a project being ~26Gbps (3,300MiB/s), the most recent round of testing shows the upper limit is no longer constrained within the context of the current test environment deployed.
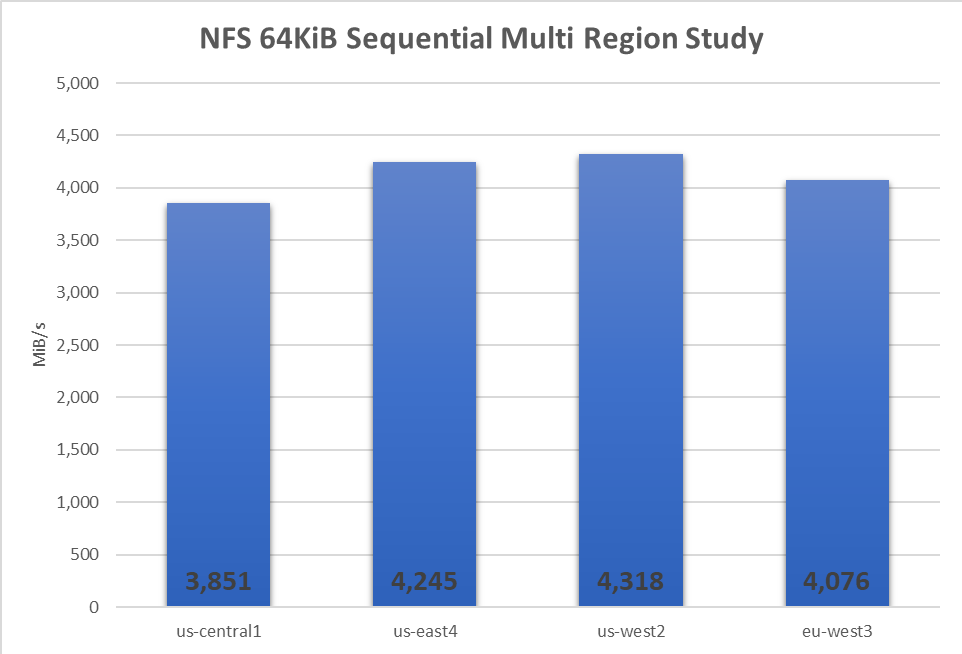
The increase in project level bandwidth are due we believe to changes the GCP software defined network implementation. To confirm that the throughput changes are not anomalous, similar load tests were repeated in each GCP region whence storage for CVS is found. We observed that all regions had a throughput profile that well exceeded the originally stated project limit of 26Gbps. As the previous investigation focused on the us-central1 region, we observed in the most recent round of tests for this region 3,851MiB/s, which is a 600MiB/s or ~20% increase in throughput over that seen in us-central1 a year back. All other regions saw above 4,000MiB/s of throughput driven by the GCE clients.
Please note that each test was run multiple times over a two-month period and that each test used a large working set (1,000GiB) thus exercising the full system stack.
GCE instance Bandwidth
To understand the bandwidth available to a GCE instance, you must understand that inbound and outbound (read and write) rates are not the same.
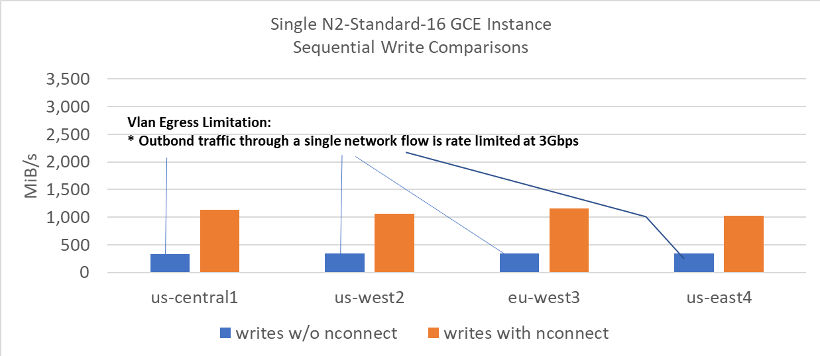
In general, each virtual machine establishes one network connection (network flow) to the storage endpoint when using the NFS protocol storage protocol. With a single network flow, writes to the cloud volume service are presently rate limited by GCP at 3Gbps while reads up to 9gbps have been observed.
A change has come to the Linux 5.3 kernel, enabling what amounts to single client scale out networking for NFS. Currently adopted by both SLES12SP4 and newer SUSE releases, as well as Ubuntu starting at version 19.10, the nconnect NFS mount option allows for the specification of up to 16 network flows (on which all I/O from each NFS mount will flow). Although implemented in a different way, this feature is similar in concept to both SMB multichannel and Oracle Direct NFS.
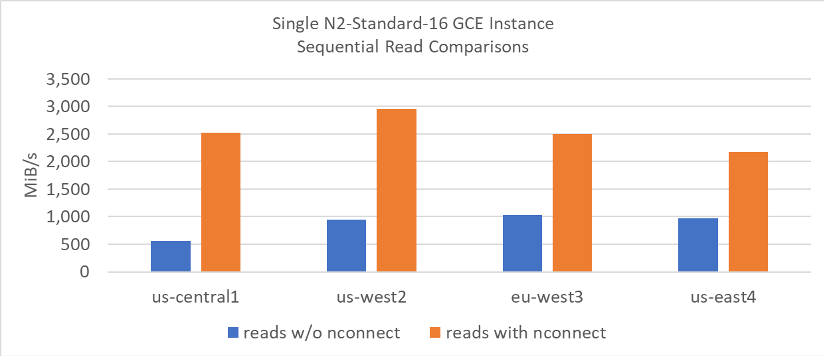
The following graphics show the throughput improvements observed when using the nconnect mount option versus the default. The write throughput seen when using nconnect approaches the upper limits of write throughput shown in the scale out section above.
Repeated testing has shown consistent regional differences in achievable per GCE instance read throughput levels. With this said, the important take away is the increase in read throughput of nconnect over the standard mount option which results in a single network flow only.
Request a Demo
Sign up now to schedule your personal Cloud Volumes Service for GCP demo.