Putting Azure NetApp Files to the test. These benchmarks show the performance that Azure NetApp Files delivers.
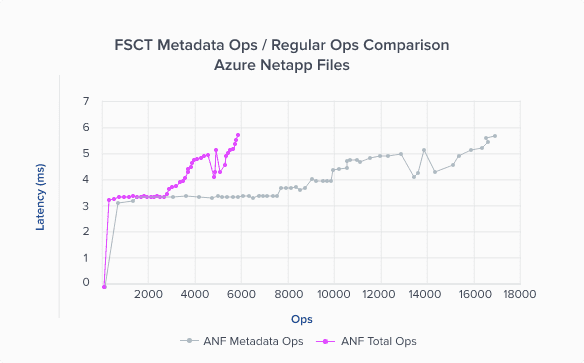
Performance CalculatorAs our benchmark testing instrument, we used the File Service Capacity tool, which measures performance in terms of users supported without “overload,” the point at which the input to the system exceeds its processing capability. It also measures the ability to schedule/complete one user scenario in 900 seconds, and 1%-2% overload for a range of users.
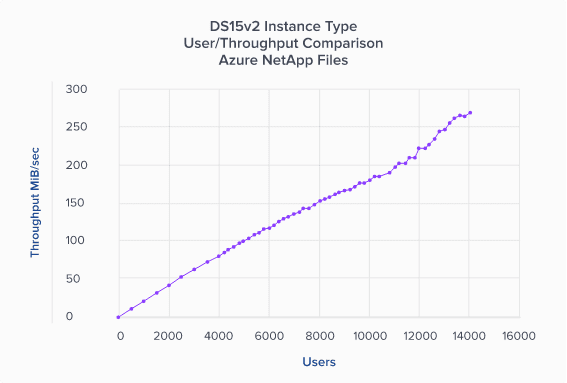
With Azure NetApp Files and multiple DS14v2 Azure Virtual Machines, the overload point occurred just past 14,000+ concurrent users. FSCT workload is metadata, rather than bandwidth, intensive, consuming just about 275MiB/s of bandwidth at the ~14,000 user load point while generating roughly 23,000 input/output operations, made up of ~17,000 metadata operations and ~6,000 read/write operations.
Though capacity needs in an actual home directory environment vary, the 80MiB of space needed per FSCT user required just over 1TiB of space. In terms of bandwidth, there are two periods to consider for the ANF home directory volume: peak and non-peak usage.During the peak-usage window, provision 5TiB of capacity to both the Premium Capacity Pool and ANF Volume. At 5TiB of allocated capacity, the ANF volume provides 320MiB/s of bandwidth. Because an ANF Capacity Pool is granular to the terabyte, and the minimum Capacity Pool size is 4TiB, reduce the capacity of both pool and volume to 4TiB during non-peak-usage to reduce costs.
The first graph represents a 64 kibibyte (KiB) sequential workload and a 1TiB working set. The graph shows that a single Azure NetApp Files volume is capable of handling between ~1,600MiB/s pure sequential writes and ~4,500MiB/s pure sequential reads.
Decrementing 10% at a time, from pure read to pure write, this graph shows what can be anticipated using varying read/write ratios [100%:0%, 90%:10%, 80%:20%, and so on].
The first graph represents a 4 kibibyte (KiB) random workload and a 1TiB working set. The graph shows that a single Azure NetApp Files volume is capable of handling between ~130,000 pure random writes and ~460,000 pure random reads.
Decrementing 10% at a time, from pure read to pure write, this graph shows what can be anticipated using varying read/write ratios [100%:0%, 90%:10%, 80%:20%, and so on].
A change has come to the Linux 5.3 kernel, enabling what amounts to single client scale out networking for NFS–nconnect. Having recently completed the validation testing for this client-side mount option with NFSv3, we’re showcasing our results in the follow graphs. Please note that the feature has been present on SUSE (starting with SLES12SP4) and Ubuntu as of the 19.10 release. This feature is similar in concept to both SMB multichannel and Oracle Direct NFS.
The four sets of graphs compare the advantages of nconnect to a non-connected mounted volume. The top set of graphs compares sequential reads; the bottom, random reads. In both sets of graphs, FIO generated the workload from a single D32s_v3 instance in the us-west2 Azure region.
Sequential Read: ~3,500MiB/s of reads with nconnect, roughly 2.3X non-nconnect.
Sequential Write: nconnect introduced no noticeable benefit for sequential writes, 1,500MiB/s is roughly both the sequential write volume upper limit as well as D32s_v3 instance egress limit.
Random Read: ~200,000 read IOPS with nconnect, roughly 3X non-nconnect.
Random Write: ~135,000 write IOPS with nconnect, roughly 3X non-nconnect.
Random I/O: With the introduction of SMB Multichannel on Azure NetApp Files, note the remarkable increase in I/O and throughput for single instance workloads (200% for I/O and up to 350% for throughput). Read the FAQ for full SMB Multichannel performance information.
SMB and NFS file share aren’t affected by storage I/O limits imposed on VMs by Azure. During testing, we saw random read IOPS of up to 100,000 on a single instance, with write IOPS of up to 82,500 on a single instance, indicating an approximately 200% increase with ANF’s new SMB Multichannel capabilities.
Sequential I/O: With the introduction of SMB Multichannel, we were able to achieve a 350% increase in sequential reads and writes using fio and a single virtual machine, with read throughput of up to 2,936MiB/s and write throughput of up to 885MiB/s.
Enabling or disabling dNFS is as simple as running two commands and restarting the database.
Enable: cd $ORACLE_HOME/rdbms/lib ; make -f ins_rdbms.mk dnfs_on
or
Disable: cd $ORACLE_HOME/rdbms/lib ; make -f ins_rdbms.mk dnfs_off
As discussed in the orafaq, Oracle Direct NFS (dNFS) is an optimized NFS client that provides faster and more scalable access to NFS storage located on NAS storage devices (accessible over TCP/IP). Direct NFS is built directly into the database kernel—just like ASM, which is mainly used with DAS or SAN storage. A good guideline is to use Direct NFS when implementing NAS storage, and ASM when implementing SAN storage. Direct NFS is installed in an enabled state.
Direct NFS is the default option in Oracle 18c and has been the default for RAC for many years.
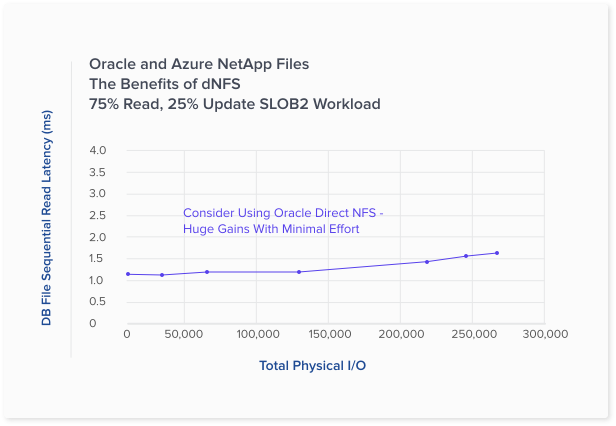
By using dNFS (available since Oracle 11g), an Oracle database running on an Azure Virtual Machine can drive significantly more I/O than the native NFS client.
The metrics in the graph, which represent benchmarks for MySQL on Azure NetApp Files, are taken from nfsiostat on the database server and as such represent the perspective of the NFS client. In the graph, we see 600MiB/s maximum throughput.
For load testing MySQL in Azure NetApp Files, we selected an industry standard OLTP benchmarking tool and continued increasing user count until throughput reached flatline. By design, OLTP workload generators heavily stress the compute and concurrency limitations of the database engine–stressing the storage is not the objective. That said, the tool used, rather than the storage, was the limiting factor in the graphs.
For this test, the following configuration was used:
Semiconductor/chip design firms are most interested in time to market (TTM); TTM is often predicated upon the time it takes for workloads, such as chip design validation, and pre-foundry work, like tape-out, to complete. That said, the more bandwidth available to the server farm, the better. Azure NetApp Files is the ideal solution for meeting both the high bandwidth and low latency storage needs of this most demanding industry.
All test scenarios documented below are the result of a standard industry benchmark for electronic design automation (EDA).
As typical in EDA workloads, functional and physical phases may be expected to run in parallel. The functional phase predominately drives random I/O and filesystem metadata operations, while the physical phase drives large block sequential reads and writes.
The graph to the right demonstrates the I/O and latency curves typical of chip design functional testing. The test harness was driven against three separate configurations: one volume, six volumes and 12 volumes. For more information on testing methodology and reasoning, please see read EDA workloads on Azure NetApp Files.
The graph to the left exposes the throughput garnered by the sequential workload phases (physical phases) of the EDA test harness. Notice that, from one to six volumes, the workload scaled linearly. Further, while 12 volumes provided little additional bandwidth, the 12-volume configuration did reduce overall latency at the edge. For more information on testing methodology and reasoning please see read EDA workloads on Azure NetApp Files.