Putting Cloud Volumes Service for AWS to the test. These benchmarks
show the performance that Cloud Volumes Service for AWS delivers
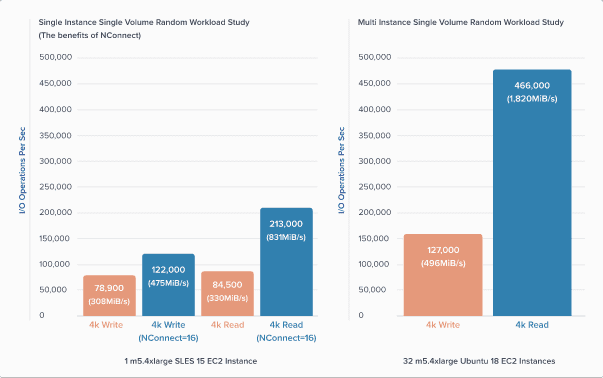
Using the FIO load generator and multiple EC2 instances, we found a single volume capable of delivering over 460K 4KiB reads and 125K 4KiB writes per second. For a single instance NFS I/O limits, with only a very little bit of NFS tuning (see nconnect mount options), we were able to drive over 200K 4KiB reads and the same 120K 4KiB writes. NetApp is working with other distributions of Linux to see the nconnect feature (present today in SLES15 and the 5.3 Linux Kernel) adopted more generally. Without the nconnect feature, testing has shown a single client capable of driving ~80K 4KiB reads/s or writes/s.
Read the full baseline performance story here.
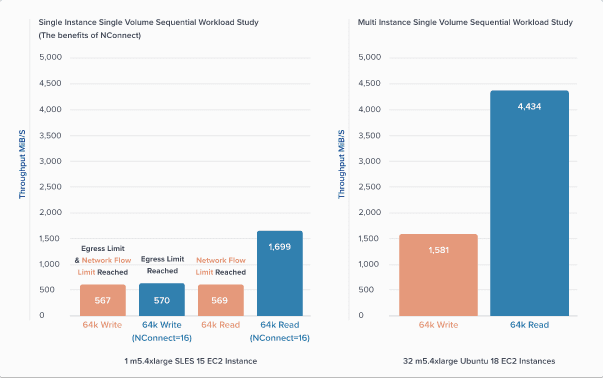
Our sequential tests were done using the exact same tests and procedures. In this case, again using the nconnect mount option (nconnect=16) and a single client we saw ~1,700MiB/s of sequential reads and 570MiB/s of sequential writes. The former is possible because nconnect creates multiple network connections (flows) for the single storage endpoint thereby getting around the AWS 5Gbps per network flow limit. The latter 570MiB/s of writes is due to AWS instance level restrictions imposed upon egress over direct connect. From a multi-client configuration, ~4500MiB/s of sequential reads and ~1500MiB/s of sequential writes were observed. For sequential workloads, a 64KiB operation size as well as a 64K rsize and wsize were selected.
The graphs compare the performance when using EBS and when using NetApp Cloud Volumes Service for AWS. The graph on the right shows that Oracle is able to drive 250,000 file system IOPS at 2ms when using the c5.18xlarge instance and a single volume provisioned from the Cloud Volumes Service, or 144,000 file system operations at below 2ms using the c5.9xlarge.
The graph to the left provides more performance examples of how Oracle workloads behave on Cloud Volumes Service for AWS when
For more information on Oracle Performance and Storage Comparison in AWS: Cloud Volumes Service, EBS, EFS.
The graph on the right shows performance when using Amazon S3 and NetApp Cloud Volumes Service for AWS (service levels Standard and Premium). It shows that Spark is able to achieve an average throughput of 3,100MB/s against a single Cloud Volumes Service volume when
Although the price of the Premium service level ($0.20/GB/month) is higher than both the Standard service level ($0.10/GB/month) and the upfront costs of Amazon S3 (capacity + egress), the increased bandwidth results in both an overall cost reduction and improved run time, making the Premium service level more cost-efficient overall.
API costs make up a large portion of the Amazon S3 price. GET requests for Standard Access Tier are priced at $0.0004 per 1,000, so the cost of continuously using Amazon S3 for primary analytics clusters can add up to ~$170,000 annually.
Read this in-depth blog on Spark performance using Cloud Volumes Service for AWS.
For load testing MySQL in Cloud Volumes Service for AWS, we selected an industry standard OLTP benchmarking tool and continued increasing user count until throughput reached flatline. By design, OLTP workload generators heavily stress the compute and concurrency limitations of the database engine–stressing the storage is not the objective. That said, the tool used, rather than the storage, was the limiting factor in the graphs.
The 450MiB/s throughput observed in this benchmark test of MySQL on Cloud Volumes Service for AWS is sidling up the 5Gbps per network flow limit imposed by AWS. The metrics in the following graph–450MiB/s maximum throughput–are taken from nfsiostat on the database server and, as such, represent the perspective of the NFS client.
For this test, the following configuration was used:
The graphs demonstrate how Cloud Volumes Service for AWS and EFS compare when running random and sequential workloads.
Elastic File System: Maximum 250/MB/s per instance throughput
Cloud Volumes: 1GB/s maximum per instance throughput (512MB/s read + 512MB/s write)
Elastic File System: Maximum 7,000 IOPS per volume (as documented by AWS)
Cloud Volumes: ~200,000 maximum IOPS per volume as tested
Here are the observed latencies in milliseconds between Amazon EC2 instances and Cloud Volumes Service for AWS based on the regions that the service is available in today.
Cloud Volumes Service for AWS was tested against competing products to move a database designed for genomic workloads to the cloud. The sequential read benchmark had 1 hour to complete - with a goal of ~10 TiB/hr (2,900MiBps). The test itself comprised 2,500 files representing 2000TIB of content.
The throughput achieved using Cloud Volumes Service volume is equal to 2,887MiBps or 9.91TiB/hr, which is 2.1x the rate of the four self-managed NFS servers and 3x times that of the Provisioned Throughput configured EFS volumes. Cloud Volumes Service for AWS achieved the results while also providing snapshot copies, which the other options were not able to provide, or not able to provide without impacting performance.
While the chart indicates a throughput of 2,887 MiBps the test data shows that only a handful of workers took longer than the rest of the 2,500 workers. In fact, most of the workers achieved a throughput of roughly 3,500 MiBps.
As additional data points, the graph on the left shows the results of the second use case - that of a SQL-type query of the 2,500 genomic files. A lower time to completion indicates strong performance. Cloud Volumes Service was able to access data from 100,000 individuals in less than an hour, while also providing snapshot copies like in the previous case.
Read this blog and accompanying report to learn more about this test and the benefits the genomics company gets with Cloud Volumes Service.
The graphs below (or to the right) show performance of a synthetic EDA workload in NetApp Cloud Volumes Service for AWS. Using six NFS cloud volumes and 36 SLES15 r5.4xlarge instance clients, the workload achieved:
Layout wise, the test generated 5.52 million files spread across 552K directories. The complete workload is a mixture of concurrently running frontend (verification phase) and backend workloads (tapeout phase) which represents the typical behavior of a mixture of EDA type applications.
The frontend workload represents frontend processing and as such is metadata intensive— think file stat and access calls—by majority metadata; this phase also includes a mixture of both sequential and random read and write operations. Though the metadata operations are effectively without size, the read and write operations range between sub 1K and 16K with the majority of reads between 4K and 16K and most of the writes 4K or less.
The backend workload, on the other hand, represents I/O patterns typical for the tapeout phase of chip design. It is this phase that produces the final output files from files already present on disk. Unlike the frontend phase, this workload is entirely comprised of sequential read and write operations, and a mixture of 32K and 64K OP size.
Graphically speaking, most of the throughput shown in the graph comes from the sequential backend workload and the I/O from the small random frontend phases–both of which happened in parallel.