hamburger icon close icon

logo-cvs-for-gcCloud Volumes Service for Google Cloud

NetApp Cloud Volumes Service for Google Cloud: benchmarks

Putting Cloud Volumes Service for Google Cloud to the test.
These benchmarks show the performance that Cloud Volumes Service for Google Cloud delivers.

Getting Started Now

image-placeholder

SectionHeading

  • Lorem Ipsum is simply dummy text of the printing
  • Typesetting industry.
  • Lorem Ipsum has been the industry's standard dummy text ever since the 1500s, when an unknown
  • Printer took a galley of type and scrambled it to make a type specimen book.
  • NFSv3 Workloads
  • Google Cloud Filestore
  • SMB Workloads
  • EDA
  • MySQL
Linux-(Scale-Out)-Workload-Throughput

Linux (scale out) workload – throughput

The first graph represents a 64 kibibyte (KiB) sequential workload and a 1TiB working set. The graph shows that a single Cloud Volumes Service volume for GCP is capable of handling between ~1,240MiB/s pure sequential writes and ~4,300MiB/s pure sequential reads.

Decrementing 10% at a time, from pure read to pure write, this graph shows what can be anticipated using varying read/write ratios (100%:0%, 90%:10%, 80%:20%, and so on).

1Linux-(Scale-Out)-Workload–IOPS

Linux (scale out) workload – IOPS

The first graph represents a 4 kibibyte (KiB) random workload and a 1TiB working set. The graph shows that a that a single Cloud Volumes Service volume for GCP is capable of handling between ~130,000 pure random writes and ~460,000 pure random reads.

Decrementing 10% at a time, from pure read to pure write, this graph shows what can be anticipated using varying read/write ratios [100%:0%, 90%:10%, 80%:20%, and so on].

NFSv3 (scale up) – throughput

A change has come to the Linux 5.3 kernel, enabling what amounts to single client scale out networking for NFS–nconnect. Having recently completed the validation testing for this client-side mount option with NFSv3, we’re showcasing our results in the follow graphs. Please note that the feature has been present on SUSE (starting with SLES12SP4) and Ubuntu as of the 19.10 release. This feature is similar in concept to SMB multichannel.

The two sets of graphs compare the advantages of nconnect to a non-nconnected mounted volume. The top set of graphs compares sequential reads; the bottom, sequential writes. In both sets of graphs, FIO generated the workload from a single N2-Standard-16 GCE instance in each of four regions – us-central1, us-west2, eu-west3, us-east4.

Linux-(Scale-Up)-Read-Throughput

Linux (scale up) read – throughput

Sequential Read: ~3,000MiB/s of reads with nconnect, roughly 3X non-nconnect.

Linux-(Scale-Up)-Write-Throughput2

Linux (scale up) write – throughput

Sequential Write: ~1,000MiB/s of writes with nconnect, roughly 3x non-nconnect.

For more information, please see our

Performance blog on NFS for Cloud Volumes Service for Google Cloud
fix-final-01

Google Cloud is now even faster with Cloud Volumes Service for Google Cloud Platform

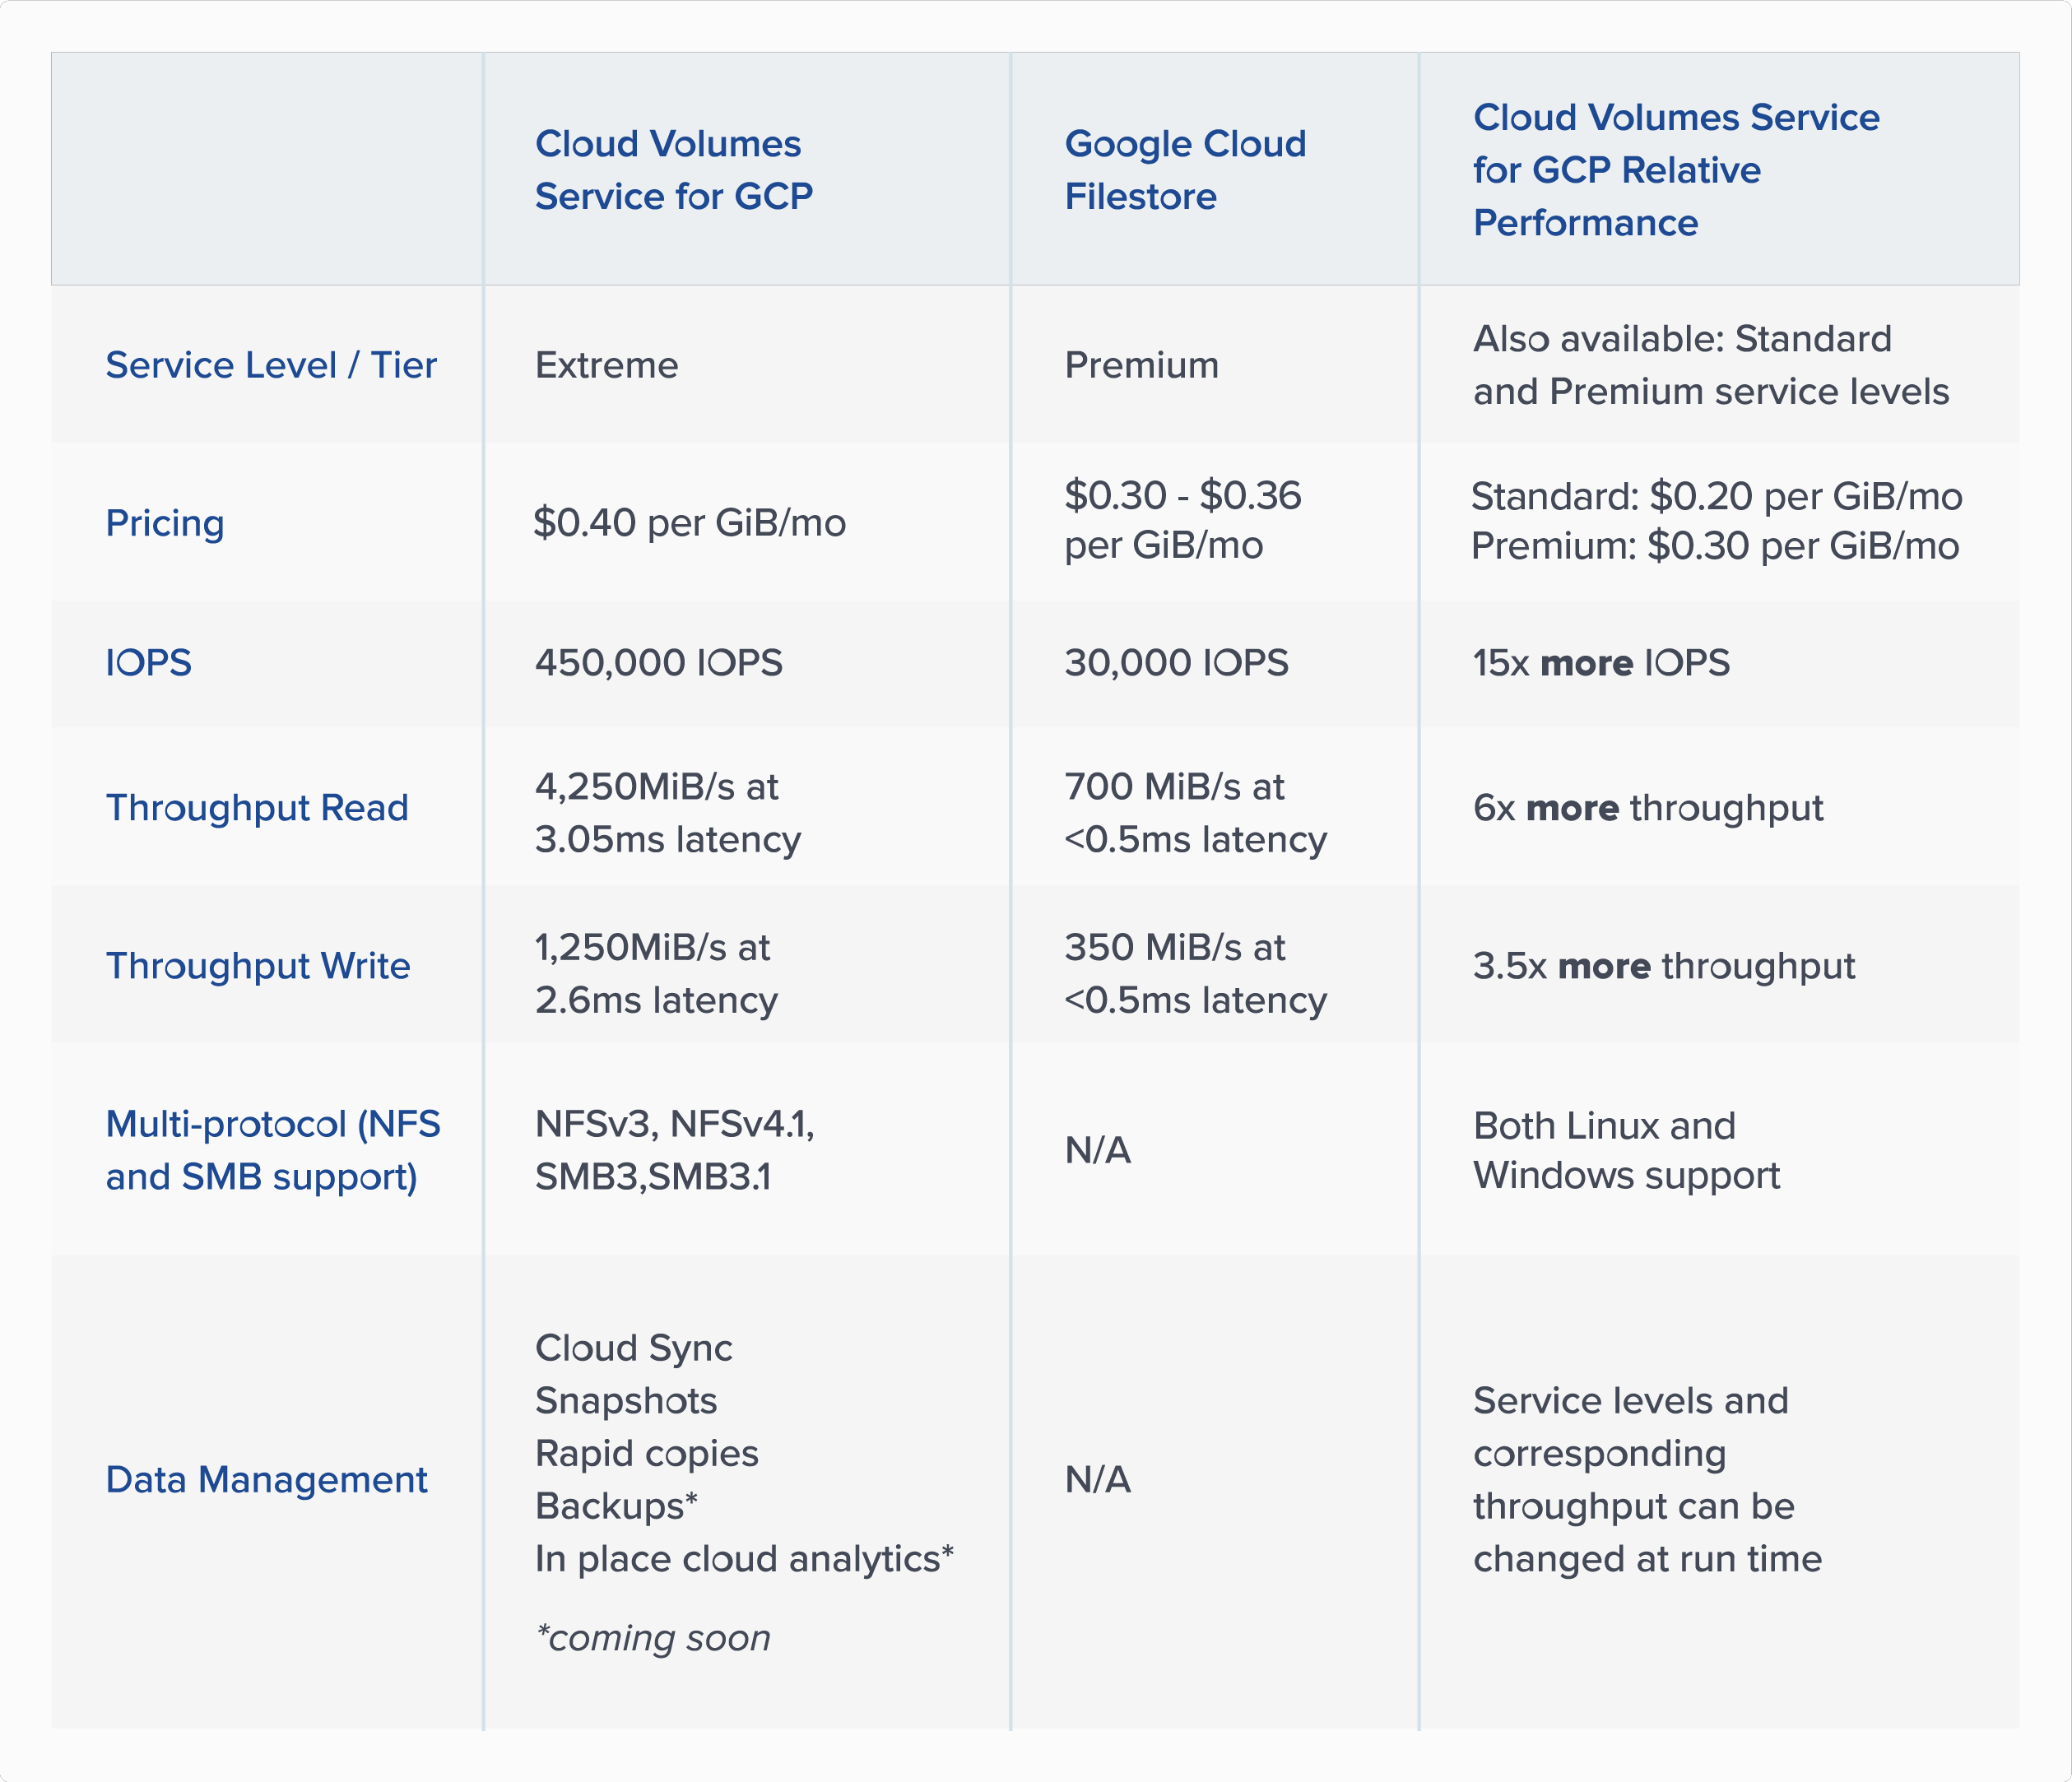
The table on the right pulls results generated during the testing for NFSv3 workload on Cloud Volumes Service for Google Cloud and information on Cloud Filestore listed by Google Cloud. Cloud Filestore enables customers to run smaller workloads they never thought possible in the cloud at a very low latency. Now, with the close partnership of NetApp and Google Cloud customers can also run their extremely demanding workloads at a low latency with Cloud Volumes Service for Google Cloud Platform!

Windows Applications With Cloud Volumes Service - IOPS

Windows applications with Cloud Volumes Service - IOPS

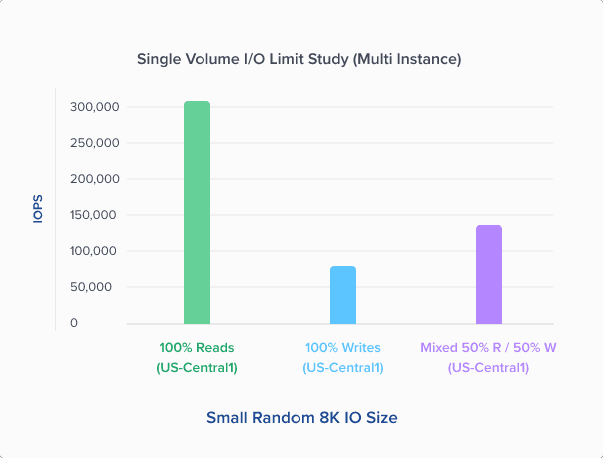
Testing shows that when run against 15 n1-highcpu-16 GCE instances, a single cloud volume has an upper limit of roughly 306,000 IOPS in us-central1.

single volume throughtput

Windows applications with Cloud Volumes Service – throughput

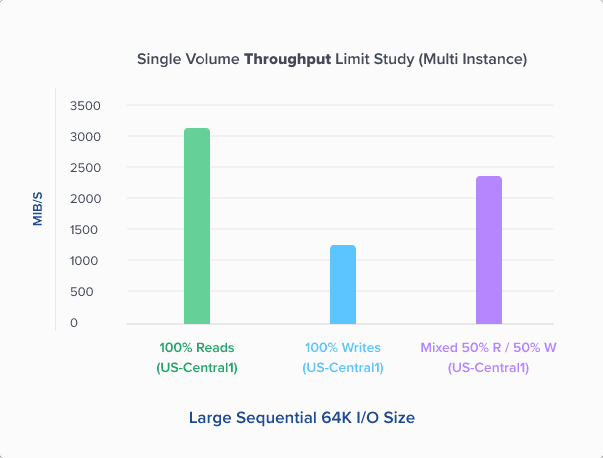
The same method was used to run sequential tests where the throughput reached ~3.1GiBps. However, the maximum amount of throughput that’s possible to generate against a single project is 3.3GiBps.

3Windows Applications With Cloud Volumes Service – Throughput

Windows applications with Cloud Volumes Service – throughput

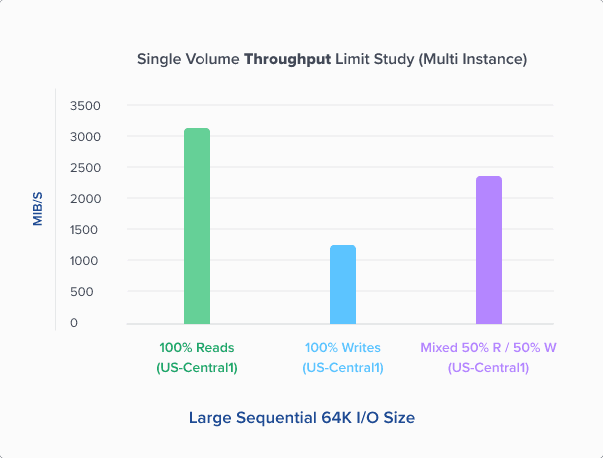
The same method was used to run sequential tests where the throughput reached ~3.1GiBps. However, the maximum amount of throughput that’s possible to generate against a single project is 3.3GiBps.

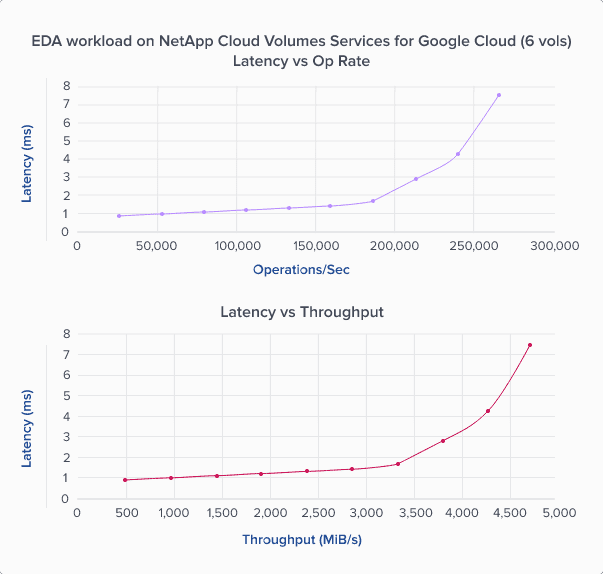
EDA Workload – Latency vs. Operations per Second Rate

EDA workload – latency vs. operations per second rate

The graphics to the right show performance of a synthetic EDA workload in NetApp Cloud Volumes Service for Google Cloud. Using 36 SLES15 n1 standard-8 GCE instances, the workload achieved:

  • 190,000 IOPS (3.3GiB/s throughput) at 2ms latency
  • 240,000 IOPS (4.3GiB/s throughput) at 4ms latency
  • 264,000 IOPS (4.7GiB/s throughput) at 7ms latency

Layout wise, the test generated 5.52 million files spread across 552K directories. The complete workload is a mixture of concurrently running frontend (verification phase) and backend workloads (tapeout phase) which represents the typical behavior of a mixture of EDA type applications.The frontend workload represents frontend processing and as such is metadata intensive— think file stat and access calls—by majority metadata; this phase also includes a mixture of both sequential and random read and write operations. Though the metadata operations are effectively without size, the read and write operations range between sub 1K and 16K with the majority of reads between 4K and 16K and most of the writes 4K or less.The backend workload, on the other hand, represents I/O patterns typical for the tapeout phase of chip design. It is this phase that produces the final output files from files already present on disk. Unlike the frontend phase, this workload is entirely comprised of sequential read and write operations, and a mixture of 32K and 64K OP size.

Graphically speaking, most of the throughput shown in the graph comes from the sequential backend workload and the I/O from the small random frontend phases–both of which happened in parallel.

The recently released nconnect mount option and NFSv3 was used in addition to the default mount options. Expect official NetApp support for the nconnect mount option and nfsv3 early 2020 and support for the same with nfsv4 early 2020.

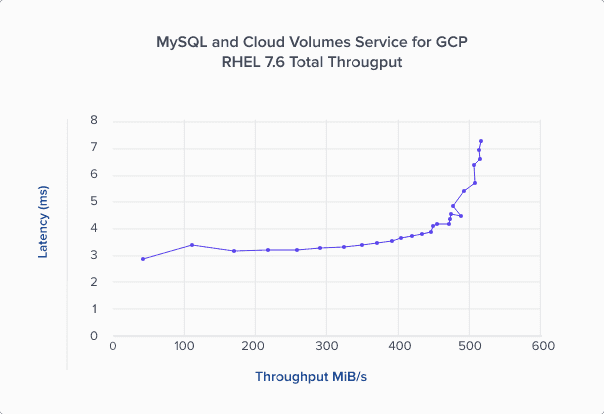
MySQL Workload – Latency Relative to Throughput

MySQL workload – latency relative to throughput

For load testing MySQL in Cloud Volumes Service for Google Cloud, we selected an industry standard OLTP benchmarking tool and continued increasing user count until throughput reached flatline. By design, OLTP workload generators heavily stress the compute and concurrency limitations of the database engine–stressing the storage is not the objective. That said, the tool used, rather than the storage, was the limiting factor in the graphs.

The metrics in the graph, which maps out benchmark data for MySQL, are taken from nfsiostat on the database server, and, as such represent the perspective of the NFS client. We observed maximum throughput of 500MiB/s.

For this test, the following configuration was used:

  • Instance type: n1-highmem-32
  • MySQL Version: 10.3.2
  • Linux Version: Redhat Enterprise Linux 7.6
  • Workload Distribution to storage: 70/30 read/write with 4KiB operation database page size*
  • Volume Count: database volume (8TiB Extreme), 1 log volume (1TiB Standard)
  • Allocated Storage Bandwidth: database volume 1024MiB/s, log volume 16MiB/s
  • Database Size: 1.25TiB